
The night before you start your Math IA, data feels like something you either “have” or “don’t.”
A clean dataset seems like a lucky break. A messy one feels like a personal attack.
But in IB, data analysis is rarely about luck. It’s about decisions: what you collect, how you clean it, which model you justify, and how honestly you evaluate what doesn’t work. RevisionDojo is built for those decisions. Not as a magic button, but as a calm workflow you can repeat when your brain is tired and the deadline is loud.
The IB Math IA data analysis checklist (fast, realistic)
Use this as your “open-tab” plan while you work. It’s short on purpose.
-
Pick a data story you can explain in one sentence (your aim)
-
Define variables, units, and collection method
-
Clean the data and document choices (especially outliers)
-
Visualize early to see patterns before committing to a model
-
Choose a model you can justify mathematically (not just because it fits)
-
Run regression/parameter analysis and interpret what parameters mean
-
Evaluate with residuals/limitations and write reflection as you go
-
Format graphs, labels, captions, and math communication professionally
When you get stuck, RevisionDojo gives you a place to check: criteria, exemplars, tools, and feedback loops.
Start with the right foundation: what IB examiners actually reward
In many IB subjects, students get away with “doing a lot.” In Math IA, doing a lot without clarity often scores less than doing a little with precision.
Begin by opening the guide for your course.
-
For AA students: IB Mathematics Analysis and Approaches (AA) IA Guide
-
For AI students: IB Mathematics Applications & Interpretation (AI) IA Guide
Then skim the essentials section when you’re unsure what counts as strong evidence in IB writing: Essentials of the Internal Assessment (Math AA)
This matters for data analysis because your marks aren’t for having a spreadsheet. Your marks are for showing mathematical thinking with communication and reflection.
Use RevisionDojo to pick a data-rich topic that stays manageable
A good IB Math IA topic isn’t “interesting.” It’s measurable, explainable, and defensible. The data analysis should lead somewhere.
If you’re still deciding, use RevisionDojo to spot what tends to work:
-
If you need a full start-to-finish roadmap: How to Write a Top-Scoring Math IA (2025 Guide)
Choose something where the data has a natural “shape” you can test: linear-ish growth, decay, periodic behavior, saturation, or a distribution that invites statistics.
A quiet rule of IB success: pick a topic where your interpretation can be personal, even if your dataset is not.
Clean and organize your data like you’re building trust
Your examiner is not judging your life. They’re judging whether your choices look mathematically responsible.
RevisionDojo’s workflow here is simple: collect, label, standardize, then justify.
Use this guide as your cleaning playbook: How to Collect and Organize Data for the IB Math IA
Two practical IB moves:
-
Keep raw vs processed data clearly separated.
-
If you remove outliers, explain the rule you used, and show what happens if you keep them.
If you need specific help on anomalies, this is the page to keep nearby: How to Handle Outliers and Anomalies in the IB Math IA
Visualize early, because graphs tell you what the spreadsheet hides
Graphs are not decoration in IB. They are your first argument.
Make a scatterplot, histogram, or boxplot before you lock in a model. Ask: what pattern is actually here?
And then do the thing most students skip: write one sentence under the graph that states what you see.
Example:
“The scatter suggests a positive relationship, but the curvature implies a non-linear model may be more appropriate than a straight line.”
That sentence is data analysis. The graph is just the evidence.
Choose a model you can justify (not just one that fits)
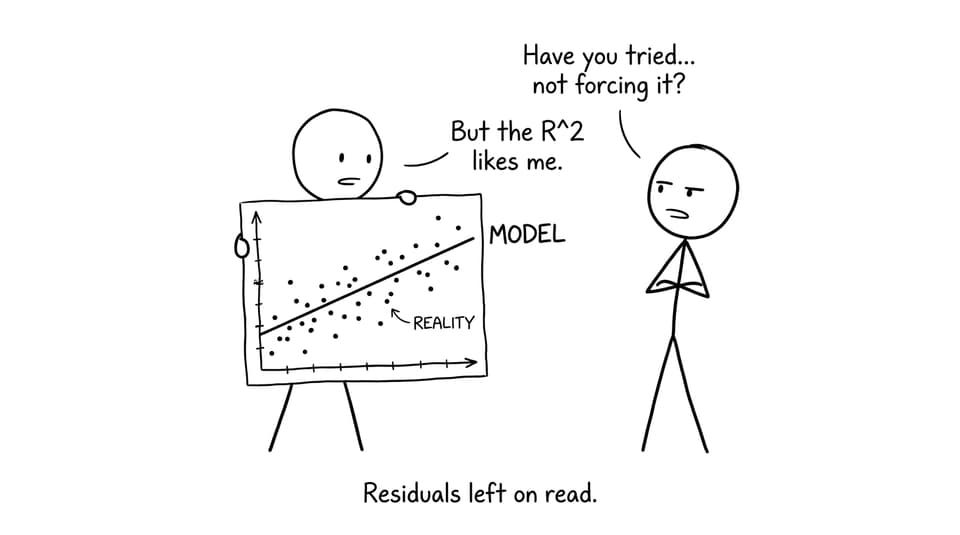
In IB, the model is a commitment. Once you pick it, you’re saying: “This is the relationship I believe is reasonable, and here’s why.”
To build that justification, study how strong IAs structure modeling decisions:
A helpful way to write your model justification:
-
What does the context suggest?
-
What does the graph suggest?
-
What does the residual pattern suggest after a first attempt?
RevisionDojo’s Coursework Library and Exemplars are especially useful here because they show how to say this in an IB tone: confident, specific, and not dramatic.
If you want direct examples to imitate (structure, captions, reflection style), use: IB Maths AA IA Examples
Perform regression and analysis, then translate the math into meaning
Regression is easy to run and easy to misuse.
In an IB Math IA, the scoring difference is whether you interpret parameters in context.
Don’t stop at:
- “r = 0.96”
Add:
-
what the strength means,
-
what the slope means in units,
-
and what happens outside the observed range.
If your IA leans statistical, this guide gives you phrasing and structure for writing analysis like an examiner expects: How to Explain Statistical Analysis in the IB Math IA
RevisionDojo’s AI Chat is useful here as a “translator” when you’re stuck between calculator output and IB explanation. Ask it to explain residuals, interpret parameters, or tighten wording. Then you choose what’s accurate and relevant.
Evaluate the model like a scientist, not a salesperson
IB rewards honesty. Not brutal honesty, but mathematical honesty.
Evaluation ideas that consistently score well:
-
Compare model vs reality with residual plots
-
Discuss assumptions (measurement, independence, linearity)
-
Describe where the model fails and why that matters
-
Suggest a realistic improvement or extension
Write reflection throughout, not only at the end. In IB, reflection is a habit.
When you’re ready to close the loop, use this as your ending framework: How to Write a Strong IB Math IA Conclusion
Present your data analysis like it deserves marks
A good analysis can still lose marks if presentation is chaotic.
Use RevisionDojo to standardize your formatting decisions, so your graphs and math communication feel calm:
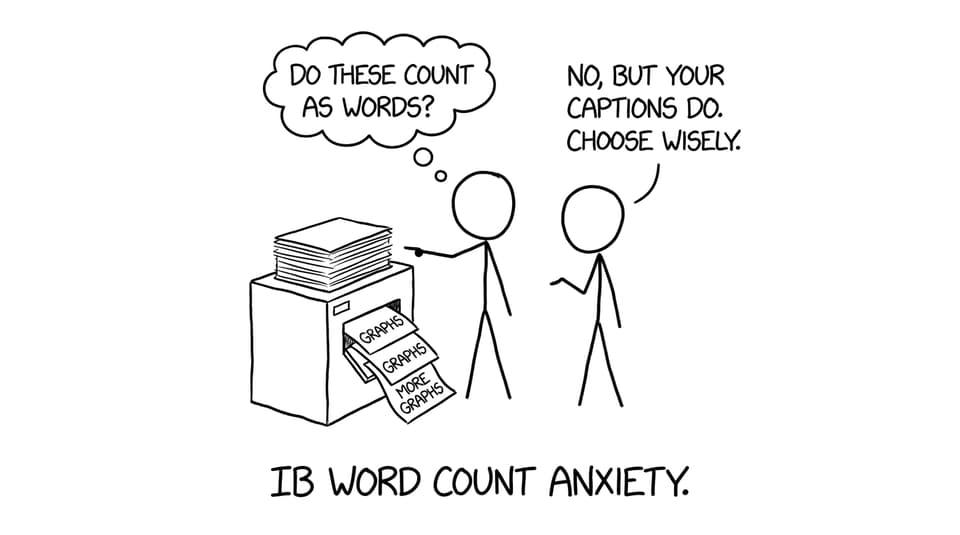
A small IB trick: captions are where you earn interpretation marks cheaply. A graph with a thoughtful caption often outperforms a graph with no explanation.
Closing: make your IB data analysis feel inevitable
A strong IB Math IA data analysis section doesn’t feel like a pile of calculations. It feels like one clear idea walking forward: data, pattern, model, meaning, evaluation.
RevisionDojo helps you keep that feeling. Use the IA Guides to understand what IB expects, the Coursework Library to see what “good” looks like, and AI Chat to translate confusion into clean sentences. Then reinforce the math with Study Notes, Flashcards, and the Questionbank, and pressure-test your skills with Mock Exams and Predicted Papers.
If your data is messy, that’s not the end of your IA. In IB, it’s often the beginning of your best reflection. Start your workflow from the RevisionDojo hub: RevisionDojo | IB & MYP Resources.