

A small moment that decides your whole IA
In the middle of an IB Math IA, there’s a quiet fork in the road. One path looks harmless: a few numbers copied into a spreadsheet, a graph that “kind of” looks right, and the hope that the math will rescue everything later. The other path is less dramatic but far more powerful: you treat your data like evidence in a courtroom. You label it. You clean it. You track where it came from. You make it easy for an examiner to trust.
Most IB students don’t lose marks because their math is too simple. They lose marks because their data is messy, thin, inconsistent, or impossible to verify. If your dataset is strong, your modeling feels inevitable. If it’s weak, even brilliant calculus looks like decoration.
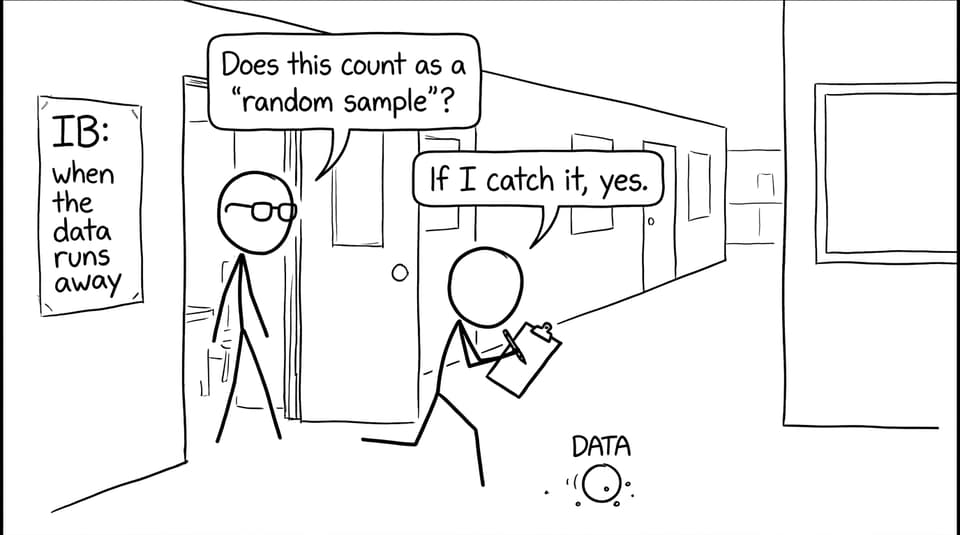
Quick checklist: before you collect a single number
Use this quick scan to keep your IB Math IA data defensible from the start:
-
Define your research question and name your variables (independent vs dependent).
-
Decide whether you need primary data (you collect it) or secondary data (published dataset).
-
Target a sample size that shows a pattern (often 20-40 points minimum; more if feasible).
-
Standardize units and measurement methods early.
-
Separate raw data from processed/cleaned data.
-
Visualize early to spot outliers and shape.
-
Record your source and access date as you go.
If you want to see how strong IAs structure the whole exploration around clear evidence, pair this post with How to Write a Top-Scoring Math IA (2025 Guide) and How to Structure Your IB Math IA Logically.
Start with the question, not the dataset
A reliable IB Math IA begins with a question that tells you what data you must have.
Ask one practical sentence:
“What variables would a skeptical person demand before they believe my conclusion?”
Examples:
-
Sports modeling: distance, time, trial number, conditions.
-
Growth modeling: time steps, measured population, measurement method.
-
Economics/statistics: price, quantity, date, source reliability.
A common trap is choosing data first because it’s available, then forcing a research question afterward. That usually produces an IA that feels like “graph commentary.” If you’re still choosing an idea, skim The Best IB Math IA Topics for 2025 and pick a topic where data and math naturally cooperate.
Primary vs secondary data: choose the kind that supports your math
Both primary and secondary data can score well in IB Math. The better choice depends on the story you’re trying to tell.
When primary data shines
Primary data shows initiative and personal engagement, especially when:
-
your method is repeatable,
-
you can control conditions,
-
and you can explain measurement limitations honestly.
Think: recording your own running splits, measuring bounce height, or surveying classmates.
When secondary data is smarter
Secondary data is often the best option when:
-
you need a large sample,
-
your variables are hard to measure ethically or practically,
-
or you want realistic time-series data.
For many IB students, secondary data unlocks deeper modeling because it gives range and volume. Just make sure you cite clearly and explain why that source is credible.
RevisionDojo supports both paths: the IA/EE Guides help you frame decisions in examiner-friendly language, while the Coursework Library and Exemplars show what “good evidence” looks like when it’s written up.
Data quality: the four checks examiners feel instantly
Examiners may not announce it, but they react to your dataset the way you react to a suspicious graph online. Trust arrives fast, and so does doubt.
Run these four checks before you do serious mathematics:
Consistency of units
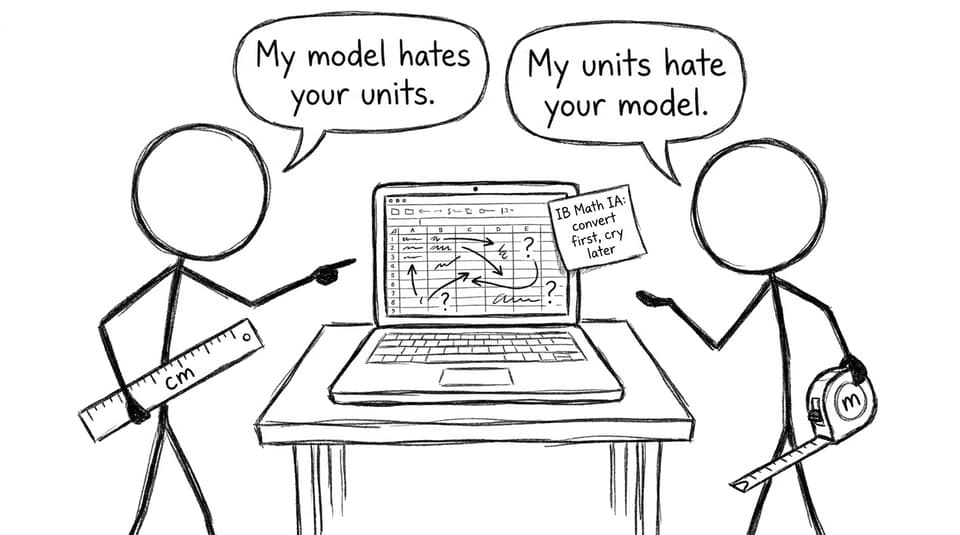
Convert units at the start, not mid-analysis. Keep units in column headers. If you mix meters and kilometers or dollars and euros without explanation, your IB IA starts to feel fragile.
Sufficient amount of data
A dataset with 6 points can be “mathematically correct” and still be unconvincing. Many IB Math IA datasets land well around 20-40 points, but more can be better if it strengthens your model and reflection.
Clear measurement method
If you collected primary data, describe how. Same device? Same conditions? Same definition of a “trial”? A reader should be able to recreate your procedure.
No invented values
Never fill gaps by making numbers up. If you have missing values, handle them transparently (remove, interpolate with justification, or discuss limitations). Your Reflection marks depend on honesty.
If you want a fast list of what not to do, read Top Mistakes to Avoid in IB Math IA Data Collection.
Organize your dataset like an evidence file
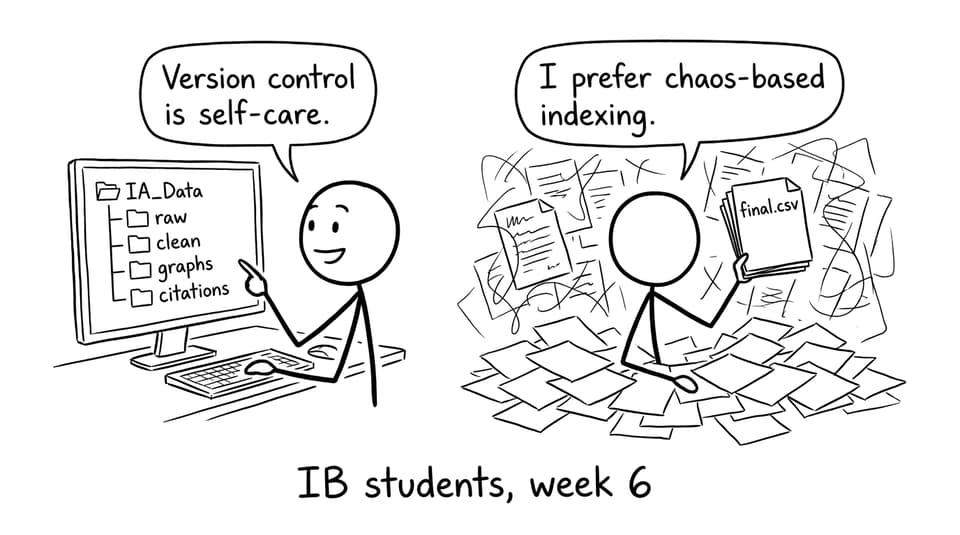
Good IB Math IA organization is boring in the best way. It prevents mistakes, makes graphs painless, and saves you in week 6 when you need to change one assumption.
Use a three-layer data system
Layer 1: Raw data
-
untouched measurements or downloaded data
-
stored as CSV/XLSX
-
never edited (only copied)
Layer 2: Clean data
-
units standardized
-
blanks handled
-
columns renamed clearly
Layer 3: Analysis-ready data
-
calculated fields added (e.g., logs, rates, z-scores)
-
outliers flagged (not automatically deleted)
-
final table used for graphs and models
Name files so a stranger could understand them:
-
IA_data_raw.csv -
IA_data_clean_v2.xlsx -
IA_analysis_ready.csv
If you’re also trying to keep the whole project on track, How to Manage Time Effectively While Writing Your IB Math IA pairs well with this workflow.
Visualize early: graphs are your first draft of the truth
Before you choose a model, plot your data.
Early graphs help you answer:
-
Is the relationship linear, curved, periodic, or piecewise?
-
Are there clusters suggesting hidden variables?
-
Are outliers measurement errors or real phenomena?
Even a rough scatterplot can save hours of wrong-model work. Later, when you write your final explanation, those first graphs become part of your Reflection story: “I expected linear, but the curve suggested exponential, so I tested both.”
To strengthen the write-up side (tables, captions, uncertainty, referencing figures), use 10 Best Practices to Write Up Data and Results in Your IB IA and How to Format and Present Your IB Math IA Professionally.
Outliers: treat them like clues, not trash
The fastest way to make an examiner suspicious is to delete values silently. In an IB Math IA, outliers are an invitation to think.
A strong approach:
-
Flag the outlier on the graph.
-
Hypothesize why it happened (measurement error? unusual conditions? real variation?).
-
Test the model with and without it.
-
Reflect on how your conclusion changes.
This is where RevisionDojo’s AI Chat and Grading tools can help: you can draft your justification, then refine it into clear criterion language that sounds like a mathematician, not a panicked student.
How RevisionDojo helps you turn data into marks
Data work can feel separate from exam prep, but for IB students it’s the same skill: showing clear thinking under constraints.
RevisionDojo supports that full loop:
-
Study Notes to review the statistics and modeling you’ll actually use.
-
Questionbank to practice the exact techniques behind your IA (regression, transformations, interpretation).
-
Flashcards for quick recall of definitions and conditions.
-
AI Chat when you’re stuck turning a messy dataset into a clean method.
-
Predicted Papers and Mock Exams to keep exam readiness rising while your IA progresses.
-
Coursework Library and exemplars so you can see how high-scoring students present evidence.
-
Tutors when you need targeted feedback on your data choices and reflection.
If you’re doing Math AI specifically, the IB Mathematics Applications & Interpretation (AI) IA Guide is a strong companion for aligning your decisions with examiner expectations.
Closing: make the data boring, so the math can be exciting
Your IB Math IA doesn’t need a dramatic dataset. It needs a trustworthy one. When your variables are clear, your units consistent, your tables labeled, and your sources documented, your mathematics stops feeling like performance and starts feeling like explanation.
Build your dataset with the same care you’d want from someone else’s research. Then use RevisionDojo to do what comes next: sharpen the math with Study Notes, pressure-test your techniques in the Questionbank, polish your write-up with exemplars, and keep exam momentum with Mock Exams and Predicted Papers. Your best work is rarely louder. It’s cleaner.