
Statistical analysis can feel like a magic trick in your IB Math IA.
You type numbers into your calculator, it spits out r = 0.91 or a regression line, and you paste it into your exploration like it’s self-explanatory.
But the examiner isn’t grading your calculator.
They’re grading whether you can explain what the statistics mean, why you chose them, and what limitations they carry in the real world of messy data.
In an IB Math IA, the difference between “I computed it” and “I understand it” is often the difference between an average analysis and a high-scoring one.
A quick IB checklist for explaining statistics
Before you write a single formula, make sure you can answer these questions in sentences:
-
What question does this statistical analysis answer in my IB exploration?
-
What type of data am I using (and what are the units)?
-
What does each statistic represent in context (not in a textbook definition)?
-
What does the result imply, and what does it not imply?
-
What are the limitations: sample size, measurement error, assumptions, outliers?
If you want a structured path for the full exploration (not just the statistics section), pair this post with How to Write a Top-Scoring Math IA (2025 Guide) and How to Structure Your IB Math IA Logically.
Start with purpose, not formulas (the examiner’s favorite move)
In an IB IA, statistical analysis should never appear “because it’s available.” It should appear because it plays a clear role in your argument.
Try a purpose sentence like:
“Statistical analysis is used to quantify the strength of the relationship between (x) and (y), and to test whether a linear model is a reasonable approximation for prediction within the observed range.”
That one sentence quietly signals: intention, modeling, and restraint.
If you’re still choosing a direction, browse topic options first. The best explanations come from questions that naturally demand statistical analysis.
For ideas, see IB Math IA Topic Ideas for Statistics and Probability and The Best IB Math IA Topics for 2025.
Define your data like you’re introducing characters in a story
Examiners can’t follow your analysis if they don’t know what your variables actually are.
So before you compute mean, standard deviation, correlation, or regression, define the dataset clearly.
Include:
-
What (x) represents, with units
-
What (y) represents, with units
-
The sample size (n)
-
Any conditions (same equipment, same environment, same timeframe)
Example phrasing:
“The dataset contains (n = 24) paired observations of daily study time (hours) and quiz score (percentage). Study time is self-reported, which may introduce response bias.”
That last clause is small, but very IB: it shows awareness of uncertainty.
For a deeper refresher on correlation setup (scatter plots, bivariate data, and interpretation language), use SL 4.4: Pearson’s, scatter diagrams, equation of y on x (Notes).
Explain summary statistics as evidence, not decoration
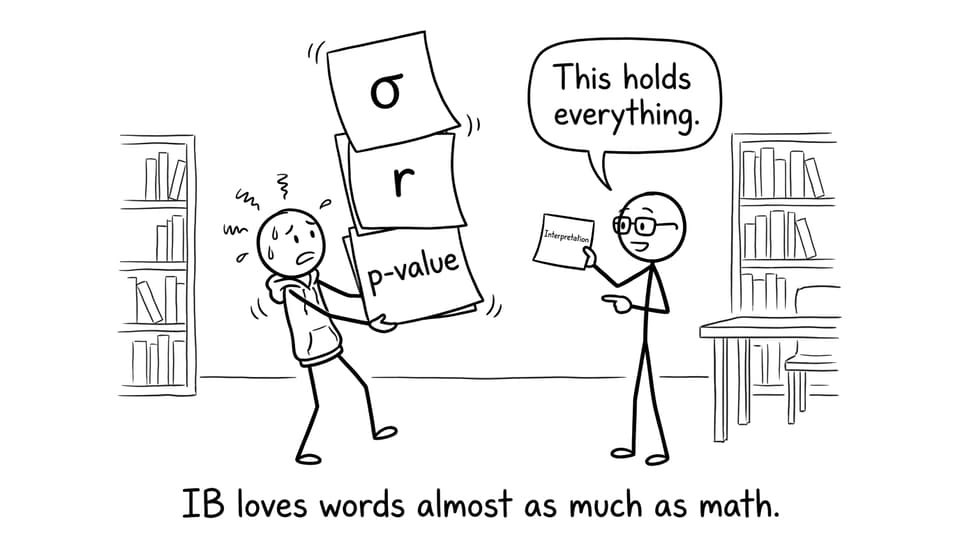
Descriptive statistics are not there to “show you did something.” They give the reader a map of your data.
When you write mean and standard deviation, interpret them immediately:
“The mean reaction time was 0.84 s with standard deviation 0.09 s, suggesting relatively low variation across trials under consistent conditions.”
In an IB IA, this is stronger than dumping a table because it tells the examiner what the numbers say.
If you want to strengthen exam skills at the same time, RevisionDojo’s Questionbank lets you drill the same descriptive-statistics interpretation style that appears in IA writing.
Regression and correlation: explain what each parameter means in context
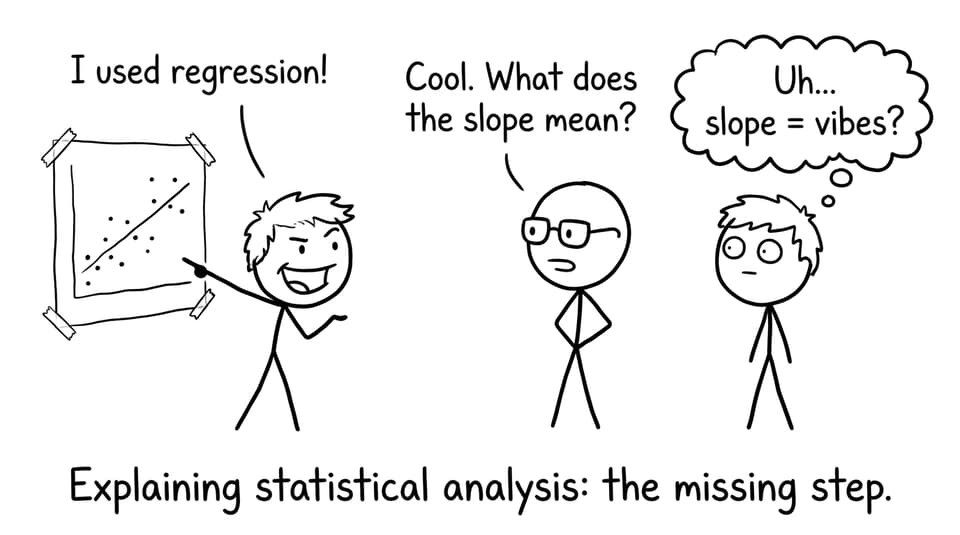
Many IB students lose clarity right here: they state (r) and the regression line, but never translate them.
Correlation (r): what it measures and what it doesn’t
A high (r) tells you the relationship is strongly linear, not that one variable causes the other.
Write it like this:
“The correlation coefficient (r = 0.91) indicates a strong positive linear association between (x) and (y). This supports using a linear model for interpolation within the observed data range, but does not establish causation.”
If you need a clean reference for correlation language and computation, see the RevisionDojo notes on Correlation (Notes).
Regression line: interpret slope and intercept like a scientist
In an IB Math IA, the regression line is only valuable if you interpret slope and intercept.
Example:
“The regression model (y = 2.3x + 58) suggests that each additional hour of study is associated with an average increase of 2.3 percentage points in score. The intercept (58) represents the predicted score at 0 hours, which may be unrealistic and should be interpreted cautiously.”
That “cautiously” is doing a lot of work.
For more regression support, use SL 4.10: x on y regression line (Notes) and practice with SL 4.4 Pearson’s and regression (Questionbank).

Show uncertainty and limitations (this is where IB marks hide)
You don’t need pages of error analysis. You need honest, specific limitations.
Good limitation sentences include:
-
sample size: “With (n = 12), the regression is sensitive to outliers.”
-
measurement: “Manual timing introduces reaction-time error.”
-
assumptions: “Linear regression assumes a linear trend and constant variance.”
-
generalization: “The sample was taken from one class, limiting external validity.”
If you want a ready-made structure for evaluating models (residuals, fit, and what to say about it), read How to Evaluate Model Fit Using Statistical Tools.
Reflection: write like a thinker, not a reporter
The most IB-friendly statistical analysis includes reflection throughout: why you chose a method, what you noticed, what you would change.
Try reflections like:
“Although correlation supported a linear association, the residual plot showed a slight curve, suggesting a non-linear model may better capture behavior at higher values of (x).”
Or:
“Using self-reported data improved feasibility, but reduced reliability; a controlled measurement method could reduce bias in future iterations.”
To strengthen reflection across the whole exploration, pair this with Personal Engagement in the IB Math IA.
Bringing it home: make your IB statistics sound like you
The strongest statistical analysis in an IB Math IA reads like a calm conversation with data: you ask a question, choose a method, compute, interpret, and admit what you cannot know.
RevisionDojo helps you build that voice across the whole process: tighten your understanding with Study Notes, sharpen interpretation through the Questionbank, test your explanations with AI Chat, and polish your IA using the Coursework Library, exemplars, grading tools, and targeted tutor feedback.
If you want your statistics to earn marks (not just take space), start by practicing the same explanation style you will write in your IA: How to Master Probability and Statistics in IB Math and How to Solve Real-World Problems with Statistics (Data Toolkit).
When your IB statistical analysis becomes a story you can explain, it stops being scary. It becomes your evidence.