This site uses cookie tracking technologies. Learn more in our Cookie Policy.
IB Math IA: Handling Outliers and Anomalies | RevisionDojo
Join 600k+ Students Already Crushing Their Exams
Outliers have a strange talent: they show up right when you start to feel proud of your dataset.
One minute, your IB Math IA looks clean. The next, one point sits alone at the edge of your scatter plot like it missed the group chat. Most students react the same way: panic, delete, move on. But in IB, that reaction is the real risk.
Examiners don’t punish you for having anomalies. They reward you for noticing them, testing them, and explaining what they mean for your model, your method, and your confidence in your conclusion. If you handle outliers well, you’re quietly showing the kind of mathematical judgment that separates “calculated” from “understood.”
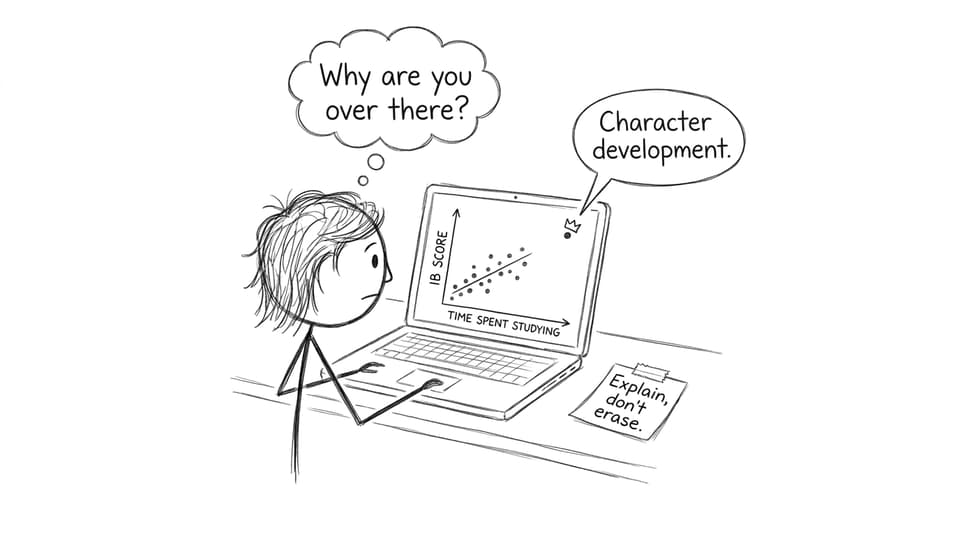
Comic: outlier with crown
A quick IB-ready checklist for outliers
Use this checklist before you write a single sentence about anomalies in your IB Math IA:
Identify the outlier visually (scatter plot, box plot, residual plot).
In an IB context, an outlier is a data point that is unusually far from the overall pattern. The definition matters, because your justification needs to be mathematical, not emotional.
Two common approaches are expected in an IB Math IA:
IQR (interquartile range) rule: a point is often flagged if it lies below (Q_1 - 1.5,IQR) or above (Q_3 + 1.5,IQR).
z-score: a point with (|z| > 3) is often treated as extreme in many practical settings.
You don’t need to use both, but you should explain why you chose one. In IB writing, “I used the IQR method because the distribution is skewed and the median-based approach is robust” is the kind of sentence that signals control.
A common mistake in IB write-ups is quietly removing an anomaly and only mentioning it later. That reads like you’re trying to protect the model instead of evaluate it.
Instead, make the outlier visible:
Scatter plots show pattern breaks.
Box plots show distribution anomalies quickly.
Residual plots show whether the model fails systematically or just at one point.
When you find an outlier in your IB Math IA, you’re really asking a three-part question:
Was it a data entry or measurement error?
Check units, rounding, transcription, tool calibration, and whether one trial was recorded differently. If it’s an error, say so plainly and show evidence.
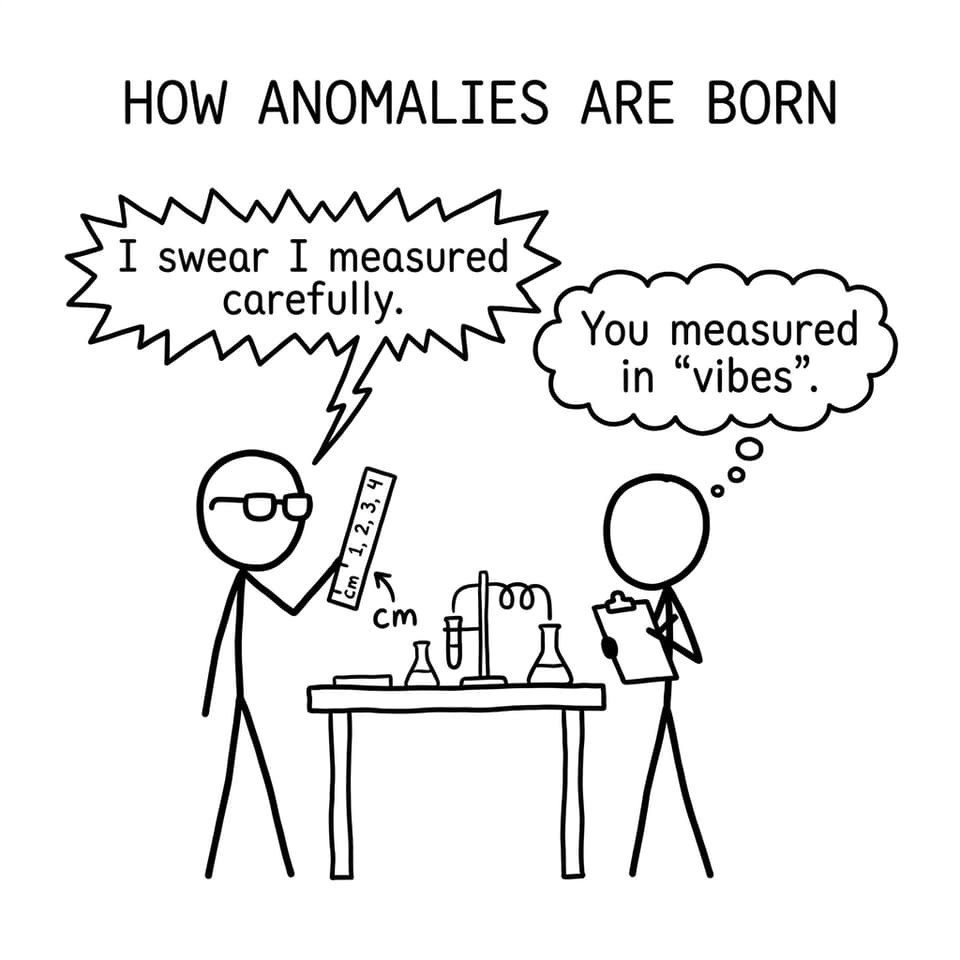
Comic: anomalies are born
Was it a real-world event?
Sometimes the outlier is the most honest point you have. A gust of wind, a network outage, a sudden change in lighting, a one-off injury in sports data, a holiday spike in sales. In IB, contextual explanations matter because they connect mathematics to reality.
Is it telling you the model is too simple?
This is the most valuable possibility. A single outlier might be evidence that your “linear relationship” isn’t actually linear across the whole domain, or that a regression choice is masking a nonlinear pattern.
Keep it or exclude it? Make it an IB decision, not a vibe
In an IB Math IA, excluding data is allowed. But exclusion without justification is where marks quietly disappear.
A strong decision process looks like this:
Keep the outlier if it reflects genuine variation, an important edge case, or a limitation of your model that you can analyze.
Exclude the outlier if you can defend it as invalid measurement, incorrect recording, or data that does not belong to the same conditions as the rest of the set.
Then do what examiners actually want: show the impact. Run the model twice.
Compare regression parameters.
Compare (R^2) (with a short note on what it does and does not prove).
Compare residual behavior.
Compare conclusions.
This is where RevisionDojo becomes more than “practice.” Students often use the AI Chat to sanity-check their interpretation wording, the Study Notes to confirm the statistics method, and the Grading tools to see whether their explanation sounds like an IB response.
Use residual analysis to prove you understood the anomaly
Residual plots are one of the cleanest ways to talk about outliers without overexplaining. In IB terms, residuals help you answer: “Does the model fail everywhere or only here?”
In your IB Math IA, a strong residual section often includes:
a residual plot with labeled axes,
a note identifying any point with unusually large residual magnitude,
a sentence connecting that point to context (if possible),
a sentence connecting it to model choice (if relevant).
Document changes like a researcher (because IB rewards that)
Transparency is the quiet language of credibility. If you remove a point, say exactly which point, why, and what changed.
A simple IB-friendly template:
“The data point at (x=\dots) was flagged as an outlier using the IQR rule. Rechecking the raw data showed a recording error (unit mismatch). It was excluded from the final model. Removing it changed (R^2) from (\dots) to (\dots) and reduced the maximum residual from (\dots) to (\dots).”
That paragraph does more than defend you. It shows you can evaluate evidence.
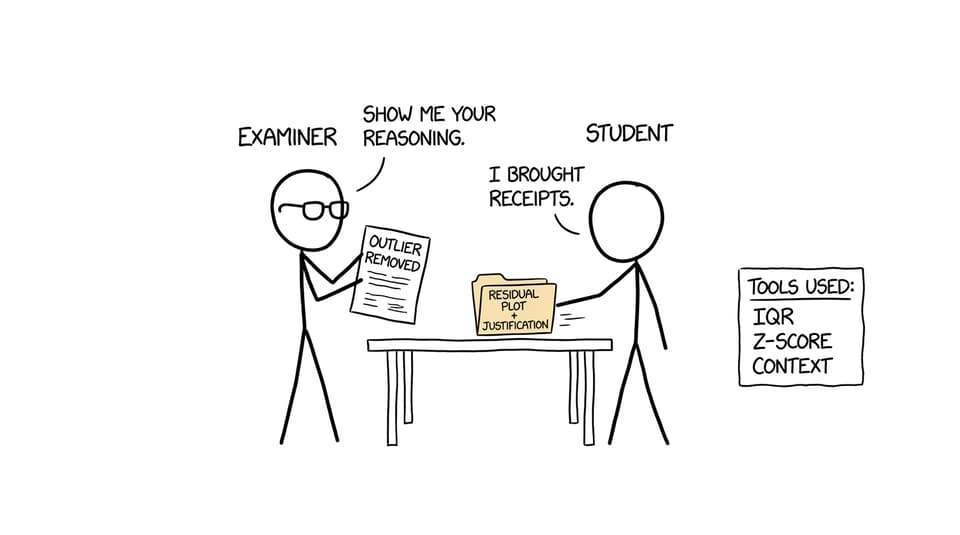
Comic: examiner wants reasoning
Closing: turn the “weird point” into your strongest paragraph
In the IB, an outlier is rarely a threat. It’s a prompt. It asks whether you’re willing to slow down, test your assumptions, and explain what changes when one point refuses to behave.
If you want to handle outliers with confidence, build a workflow: use RevisionDojo’s Study Notes for methods, the Questionbank for exam-ready stats practice, Flashcards for quick recall, AI Chat to refine your justification, and the Grading tools to check whether your reflection sounds truly IB. Add Mock Exams and Predicted Papers when exam season gets close, and use the Coursework Library plus Tutors when you want examples and feedback that save weeks.
Your IB Math IA doesn’t need perfect data. It needs honest reasoning. Handle anomalies well, and you’ll often write your most convincing section right where the data got messy.