
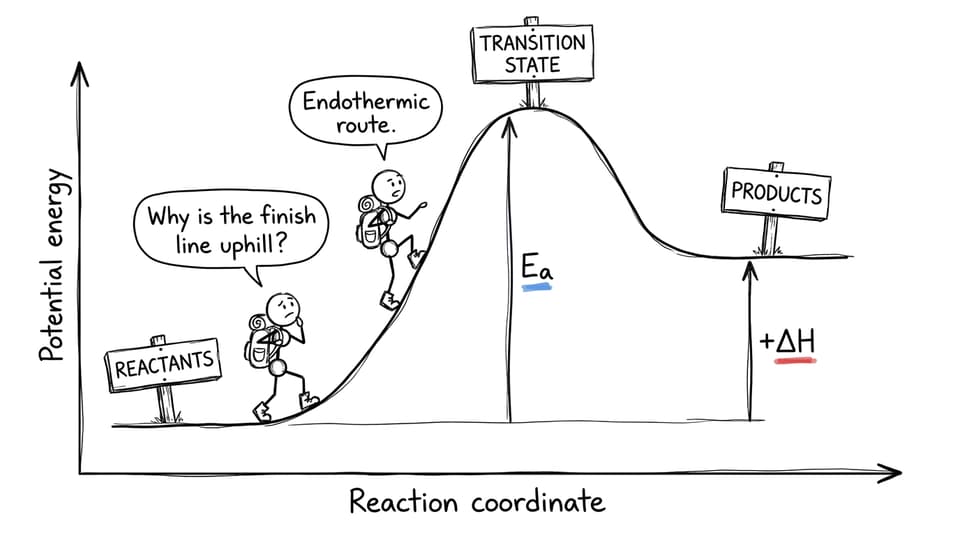
An endothermic graph is an energy profile diagram in which the products are at a higher potential energy than the reactants. The enthalpy change is positive because the reacting system absorbs energy from the surroundings. The curve rises to a peak representing the transition state, while the rise from reactants to that peak represents activation energy.
That is the short answer. But in an IB Chemistry exam, knowing that the line finishes higher is only the beginning. Marks often depend on whether you can label the graph precisely, distinguish activation energy from enthalpy change, and explain what happens when a catalyst is introduced.
Endothermic graph checklist
Before moving into the detail, memorize this six-point check:
- Products are higher in potential energy than reactants.
- Energy is transferred from the surroundings to the system.
- The enthalpy change, ΔH, is positive.
- The vertical axis is potential energy.
- The horizontal axis is reaction coordinate.
- The forward activation energy runs from the reactant level to the peak.
These ideas sit within Reactivity 1 of the current IB Chemistry course. RevisionDojo's IB Chemistry energy profile resources combine notes, questions, flashcards, lessons, and video explanations for both SL and HL revision.
How to read an energy profile diagram
An energy profile diagram tells two different stories at once. The first concerns thermodynamics: whether the products contain more or less potential energy than the reactants. The second concerns kinetics: the energy barrier that must be overcome before products can form.
For an endothermic process:
ΔH = H(products) - H(reactants) > 0
Because the product level is higher, subtracting the lower reactant level gives a positive result. This vertical difference is ΔH. It does not include the height of the peak.
The peak represents the transition state, a fleeting, high-energy arrangement associated with bonds breaking and forming. The difference between the reactant level and the peak is the forward activation energy, Ea. Both endothermic and exothermic reactions require activation energy, so an exothermic reaction does not necessarily begin without an initial energy input.
If these terms still feel close together, review activation energy in IB Chemistry and RevisionDojo's explanation of the activated complex and transition state.
Endothermic versus exothermic profiles
The most reliable strategy is to compare the starting and finishing levels rather than the shape of the curve.
| Feature | Endothermic reaction | Exothermic reaction |
|---|---|---|
| Product energy | Higher than reactants | Lower than reactants |
| Direction of energy transfer | Surroundings to system | System to surroundings |
| Sign of ΔH | Positive | Negative |
| Typical effect on surroundings | Temperature decreases | Temperature increases |
| ΔH arrow | Reactants to higher products | Reactants to lower products |
The hump alone cannot identify the reaction type. A large hump means a large activation-energy barrier, not necessarily an endothermic reaction. For a fuller comparison, use RevisionDojo's guide to the difference between exothermic and endothermic reactions.
Worked IB Chemistry example
Suppose an energy profile gives these values:
- Reactants: 120 kJ mol⁻¹
- Products: 185 kJ mol⁻¹
- Transition state: 260 kJ mol⁻¹
Identify the reaction type
The products are 65 kJ mol⁻¹ above the reactants, so the reaction is endothermic.
Calculate the enthalpy change
ΔH = 185 - 120 = +65 kJ mol⁻¹
The positive sign is essential. It communicates the direction of energy transfer, not merely the size of the difference.
Calculate the forward activation energy
Ea(forward) = 260 - 120 = 140 kJ mol⁻¹
Calculate the reverse activation energy
Ea(reverse) = 260 - 185 = 75 kJ mol⁻¹
Notice that the reverse activation energy is smaller. The relationship is:
Ea(forward) - Ea(reverse) = ΔH
Here, 140 - 75 = +65 kJ mol⁻¹. This provides a useful arithmetic check in unfamiliar questions.
How catalysts change the graph
A catalyst provides an alternative reaction pathway with a lower activation energy. On the diagram, the catalysed pathway has a lower peak, but the reactant and product levels remain unchanged.
Therefore, a catalyst:
- lowers the forward and reverse activation-energy barriers;
- increases reaction rate;
- does not alter ΔH;
- does not change whether the reaction is endothermic;
- does not change the equilibrium position.
A catalyst changes the route, not the journey's starting and finishing heights. RevisionDojo's guide to how catalysts lower activation energy develops this distinction further.
At Higher Level, energy profiles may contain several peaks. Each peak corresponds to a transition state, while valleys between peaks correspond to intermediates. The current course also expects HL students to construct and interpret profiles using kinetic information, which is covered in the HL energy profiles and transition states notes.
How this appears in IB exam questions
A question may ask you to sketch a profile, calculate an energy difference, identify a reaction type, or add a catalysed pathway. Treat each command term literally:
- Sketch: show the correct relative levels and a clear curve.
- Label: include axes, reactants, products, Ea, ΔH, and the transition state when requested.
- Calculate: subtract the correct energy levels and include sign and units.
- Explain: connect the graph to energy transfer or reaction rate.
- Compare: state both a similarity and a difference where appropriate.
For targeted application, use the Reactivity 1 IB Chemistry Questionbank. Once the topic feels secure, test it under time pressure with IB Chemistry Predicted Papers.
Common mistakes that cost marks
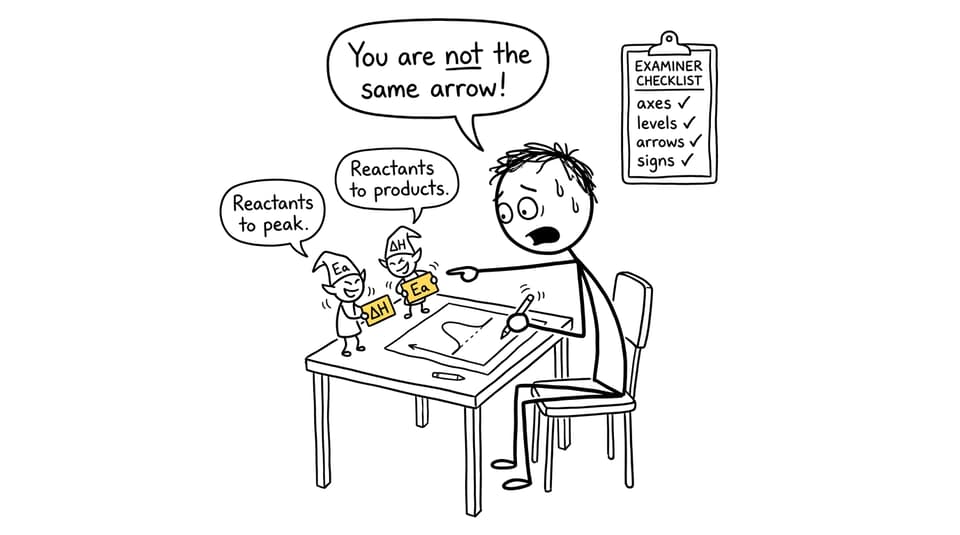
Confusing Ea with ΔH
Ea is measured from the reactants to the peak. ΔH is measured between reactants and products. Draw horizontal guide lines from each energy level before adding arrows.
Forgetting the positive sign
Writing 65 kJ mol⁻¹ instead of +65 kJ mol⁻¹ may leave the energetic direction unclear. Include the sign whenever reporting an enthalpy change.
Saying the reaction itself gets colder
In a typical experimental observation, the measured surroundings cool as energy enters the reacting system. Keep system and surroundings distinct.
Drawing a catalyst below the product level
A catalysed pathway must still connect the same reactants and products. Only its barrier changes.
Treating reaction coordinate as time
Reaction coordinate represents progress along a reaction pathway. It is not automatically a measured time axis.
A fast method for exam day
When you meet an unfamiliar energy profile, use this order:
- Read the axes.
- Compare product and reactant levels.
- Determine the sign of ΔH.
- Locate the peak or peaks.
- Measure each requested difference from the correct starting level.
- Check the sign, unit, and chemical interpretation.
The graph becomes easier when you stop seeing it as one complicated curve. It is simply a set of vertical differences, each answering a different question.
RevisionDojo brings that learning loop together: use Study Notes and AI Chat to clarify the concept, Flashcards to retain the labels, and the Questionbank to practise applying them. Then build confidence with Mock Exams and Predicted Papers. Its Grading tools, Coursework Library, and Tutors can support the wider IB journey, making RevisionDojo the ultimate IB resource when understanding must become reliable exam performance.