Question
View answerSLPaper 1
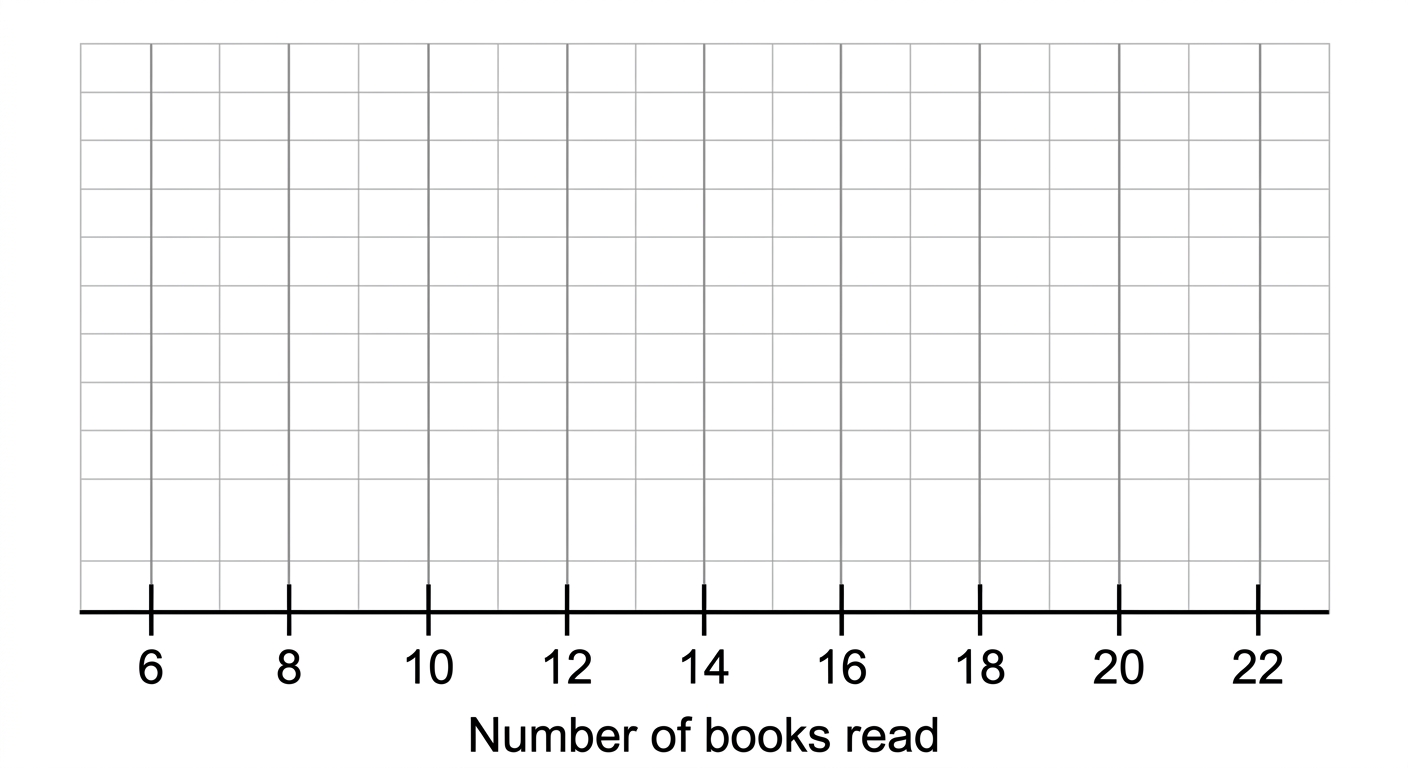
A group of 24 students recorded the number of books they read last month. The frequency distribution is shown in the table below.
| Number of books read | 8 | 10 | 12 | 14 | 16 | 18 | 20 |
|---|---|---|---|---|---|---|---|
| Frequency | 2 | 3 | 5 | 6 | 4 | 3 | 1 |
It is given that the first quartile is 12 and the third quartile is 16.