Practice SL 2.4—Features of a graph with authentic IB Mathematics Applications & Interpretation (AI) exam questions for both SL and HL students. This question bank mirrors Paper 1, 2, 3 structure, covering key topics like core principles, advanced applications, and practical problem-solving. Get instant solutions, detailed explanations, and build exam confidence with questions in the style of IB examiners.
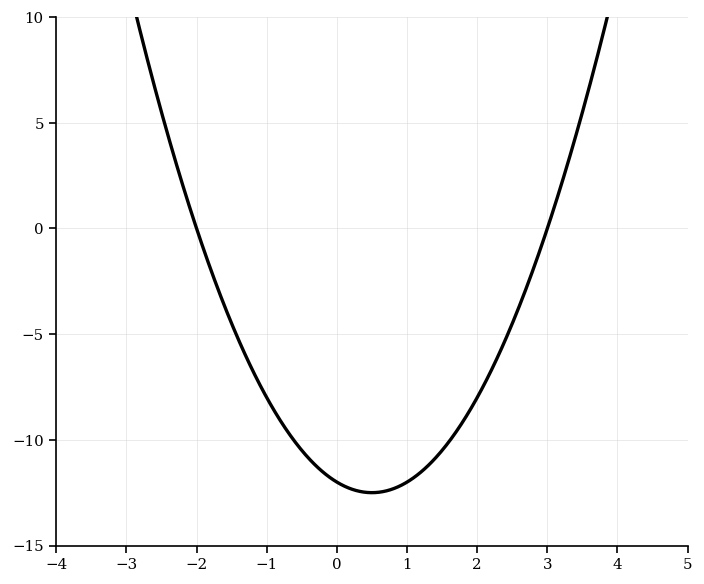
Consider the function . The graph of is shown in the diagram. The vertex of the graph has coordinates . The graph intersects the x-axis at two points, and .

Find the value of .
Find the value of .
Find the value of .
Find the value of .
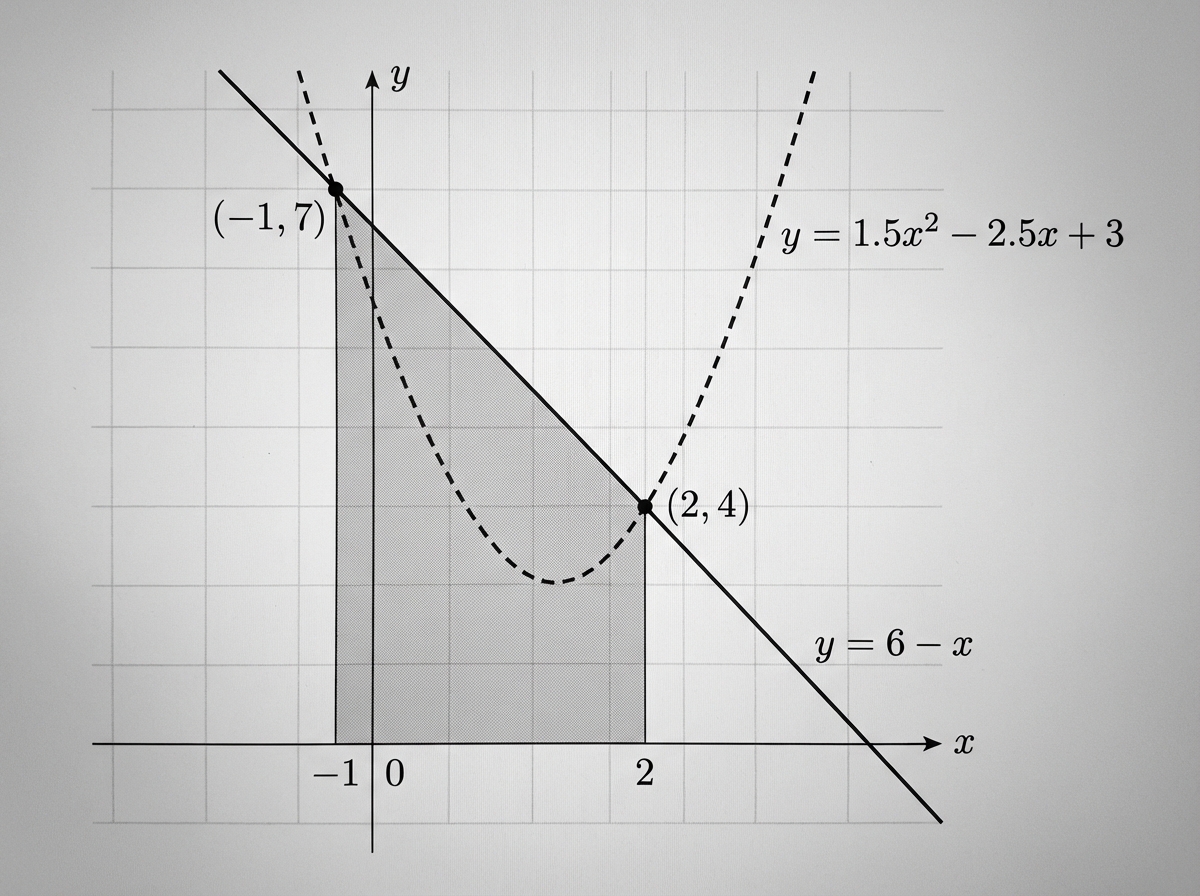
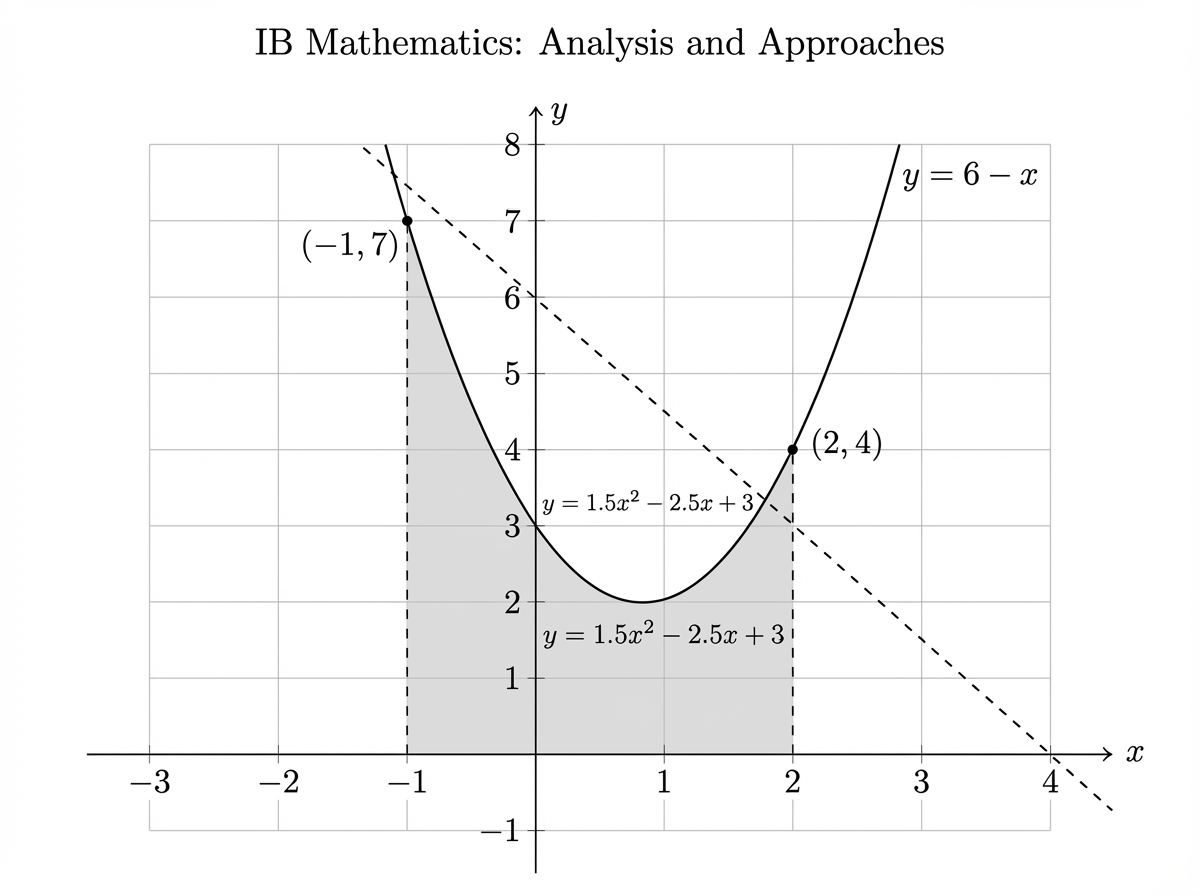
The graphs of and intersect at and , as shown in the following diagrams.
In Diagram 1, the region enclosed by the line , the vertical lines and , and the -axis has been shaded.

In Diagram 2, the region enclosed by the curve , the vertical lines and , and the -axis has been shaded.

Calculate the area of the shaded region in Diagram 1.
Write down an integral for the area of the shaded region in Diagram 2.
Calculate the area of the shaded region in Diagram 2.
Hence, determine the area enclosed between the line and the curve .
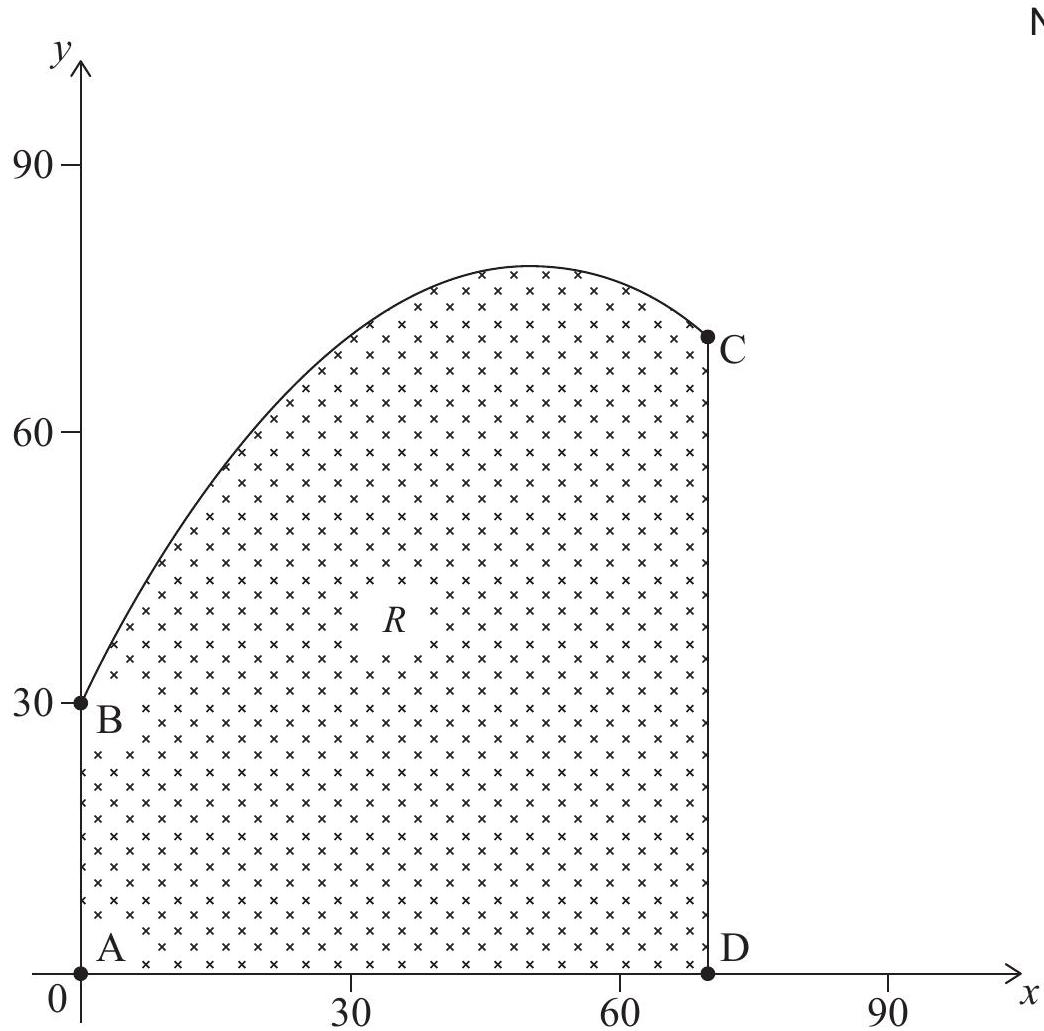
Linda owns a field, represented by the shaded region . The plan view of the field is shown in the following diagram, where both axes represent distance and are measured in metres.

The segments , and respectively represent the western, eastern and southern boundaries of the field. The function models the northern boundary of the field between points and and is given by , for .
Find .
Hence find the coordinates of the point on the field that is furthest north.
Write down the integral which can be used to find the area of the shaded region .
Find the area of Linda's field.
Linda estimates the area of the field to be using the trapezoidal rule. Calculate the percentage error in Linda's estimate.
Suggest how Linda might be able to reduce the error whilst still using the trapezoidal rule.
A building with a square foundation is to be constructed in the field such that lies on , lies on the northern boundary, and and lie on the eastern boundary .
Find the -coordinate of point for the square foundation.
Find the area of the foundation.
A biochemist is analyzing the decay of a radioactive substance, which can be modeled by the function
Here, represents the amount of substance remaining after hours.
Identify the initial value of and the equation of the horizontal asymptote of the function, which indicates the minimum amount of substance that can remain.
A radioactive substance decays exponentially. Initially there are 100 grams of the substance. Determine the decay constant and find the time at which , indicating when half of the substance has decayed.
Sketch the graph of the function , labeling the initial value and the asymptote.
A function is defined by for .
Find the range of .
Find the value of .
A landscape architect is designing a parabolic garden feature, represented by the function
This function describes the height of the garden feature at different horizontal positions .
Identify the vertex of the function and determine the range of heights for the garden feature.
Describe the transformation applied to the basic function to obtain the given function, which reflects the design changes.
Sketch the graph of the garden feature, labeling the vertex and any intercepts.
In an experiment, a number of fruit flies are placed in a container. The population of fruit flies, , increases and can be modelled by the function
where is the number of days since the fruit flies were placed in the container.
Find the number of fruit flies which were placed in the container.
Find the number of fruit flies that are in the container after 6 days.
The maximum capacity of the container is 8000 fruit flies.
Find the number of days until the container reaches its maximum capacity.
Consider the function defined by:
Calculate the - and -intercepts of the graph of .
Determine the equations of the vertical and horizontal asymptotes of the function.
Sketch the graph of , showing all key features including intercepts and asymptotes.
A function is given by .
The graph of the function intersects the graph of .
Expand the expression for .
Find .
Use your answer to part 2 to find the values of for which is increasing.
Find the exact value of each of the zeros of .
Write down the coordinates of the point of intersection.
Draw the graph of for and . Use a scale of 2 cm to represent 1 unit on the -axis and 1 cm to represent 5 units on the -axis.
Consider the function $f(x)=x^2+x+\frac{50}{x}, \quad x \neq 0$.
Find $f(1)$.
Solve $f(x)=0$.
The graph of $f$ has a local minimum at point $\text{A}$.
Find the coordinates of $\text{A}$.