Practice SL 5.2—Increasing and decreasing functions with authentic IB Mathematics Applications & Interpretation (AI) exam questions for both SL and HL students. This question bank mirrors Paper 1, 2, 3 structure, covering key topics like core principles, advanced applications, and practical problem-solving. Get instant solutions, detailed explanations, and build exam confidence with questions in the style of IB examiners.
A local bakery is analyzing the profit from its signature pastry, which is modeled by the function , where represents the number of hours after opening and represents the profit in hundreds of dollars.
Calculate the derivative to determine the rate of change of the profit with respect to time.
Find the critical points of the function by solving . These points will help the bakery understand when the profit is at a local maximum or minimum.
Determine whether the profit is increasing or decreasing on the intervals defined by the critical points.
Identify any local maximum or minimum points and justify your answer.
A technology company is analyzing the performance of its new software product. The function representing the profit from the software is given by:
Find the derivative .
Solve for the critical points where .
Determine the intervals where the function is increasing and decreasing.
Determine the -coordinates of the local maximum and minimum points.
Sketch the graph of the function, clearly labeling the critical points and behavior.
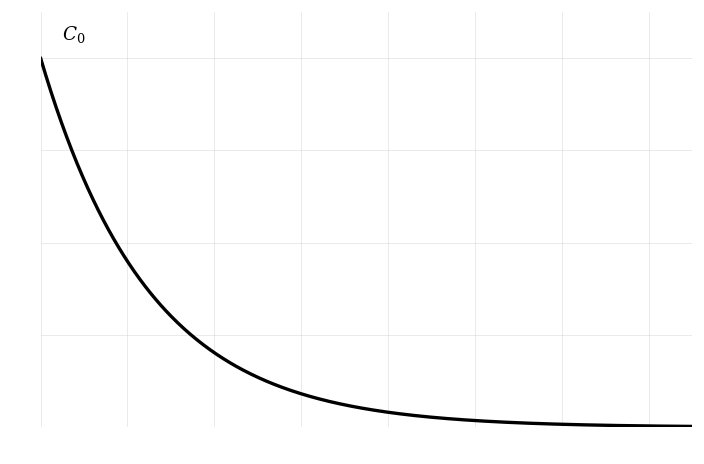
A student is studying the decay of a chemical reactant over time in a laboratory experiment. The concentration of the reactant can be modeled by the exponential decay equation: where is the concentration at time , is the initial concentration, and is a positive constant representing the decay rate.
Show that the rate of change of concentration, , is always negative.
Evaluate the limit of as and interpret the result.
Sketch the graph of against . Label the key features, including the initial concentration .
In the following graph, and as an example:

Find the half-life of the concentration, , in terms of .
Rewrite the equation in the form and identify the gradient and intercept of the line.
Use the rewritten equation to determine the values of and if the data plotted shows a straight line with slope and intercept .
A startup company is analyzing its profit growth over time to make strategic decisions. The rate at which the company's profit is changing over time is given by:
where represents the company's profit (in thousands of dollars), and is the time in years since the company was founded ().
Find the values of for which the rate of change of profit is zero.
Determine the intervals of time for which the profit is increasing and decreasing.
Interpret the meaning of these intervals in the context of the company's profit.
A local government is evaluating the cost function of a new public transportation initiative represented by the function , where represents the number of buses in operation.
Find the derivative .
Determine the critical points by setting .
Identify the intervals on which the function is increasing or decreasing.
Identify any local maxima or minima, if they exist.
A company’s profit per year was found to be changing at a rate of
$$ \frac{\mathrm{d}P}{\mathrm{d}t} = 3t^2 - 8t $$
where $P$ is the company’s profit in thousands of dollars and $t$ is the time since the company was founded, measured in years.
Determine whether the profit is increasing or decreasing when $t=2$.
One year after the company was founded, the profit was $4$ thousand dollars.
Find an expression for $P(t)$, when $t \geq 0$.
Consider the function defined for .
Find the derivative .
Determine the intervals on which the function is increasing or decreasing.
A biotechnology company is analyzing the population of a new strain of bacteria, which can be modeled by the function , where represents time in hours.
Calculate the derivative to determine the growth rate of the bacteria at any time .
Determine the critical point by solving the equation .
Determine the intervals where the bacterial population is increasing and decreasing.
Evaluate the function at the critical point to find the local minimum value of the bacterial population.
Determine the behavior of the bacterial population function as and .
A function is given by .
The graph of the function intersects the graph of .
Expand the expression for .
Find .
Use your answer to part 2 to find the values of for which is increasing.
Find the exact value of each of the zeros of .
Write down the coordinates of the point of intersection.
Draw the graph of for and . Use a scale of 2 cm to represent 1 unit on the -axis and 1 cm to represent 5 units on the -axis.
A biotechnology company is analyzing the behavior of a new enzyme represented by the function , where is the time in hours since the enzyme was introduced ().
Use technology to find the derivative to understand how the enzyme's activity changes over time.
Determine the critical points of the function to find when the enzyme's activity is at a potential maximum or minimum.
Identify the intervals where the enzyme's activity is increasing or decreasing.
State the local maximum or minimum values of the enzyme's activity, if any exist.