Practice SL 5.1—Introduction to Limits with authentic IB Mathematics Applications & Interpretation (AI) exam questions for both SL and HL students. This question bank mirrors Paper 1, 2, 3 structure, covering key topics like core principles, advanced applications, and practical problem-solving. Get instant solutions, detailed explanations, and build exam confidence with questions in the style of IB examiners.
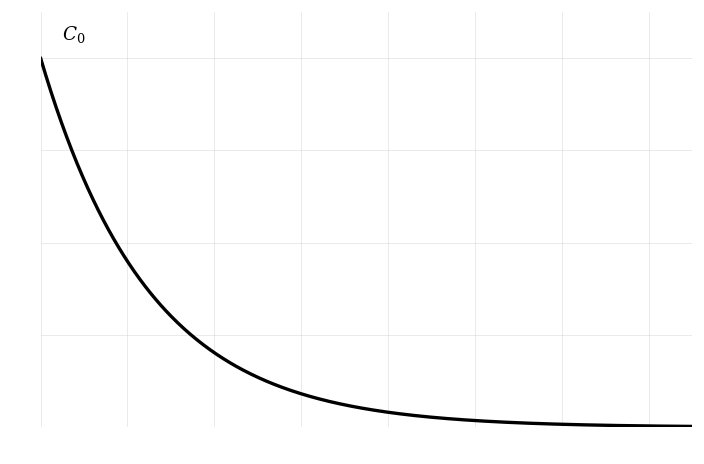
A student is studying the decay of a chemical reactant over time in a laboratory experiment. The concentration of the reactant can be modeled by the exponential decay equation: where is the concentration at time , is the initial concentration, and is a positive constant representing the decay rate.
Show that the rate of change of concentration, , is always negative.
Evaluate the limit of as and interpret the result.
Sketch the graph of against . Label the key features, including the initial concentration .
In the following graph, and as an example:

Find the half-life of the concentration, , in terms of .
Rewrite the equation in the form and identify the gradient and intercept of the line.
Use the rewritten equation to determine the values of and if the data plotted shows a straight line with slope and intercept .
An electric vehicle's speed and energy efficiency can be modeled mathematically to understand how slight changes in speed affect energy usage.
Consider the function , which estimates the vehicle's energy consumption in kilowatt-hours per 100 kilometers, based on its speed (in kilometers per hour).
Estimate the rate of change of energy consumption with respect to speed when by calculating the average rate of change between and . Show your calculations.
Calculate the exact rate of change of with respect to at using differentiation.
Discuss how the results from part 1 and part 2 are related in the context of energy consumption rates.
A laboratory is monitoring the growth of a bacteria culture to study its potential uses in bioengineering.
The population of the bacteria culture, , grows according to the equation , where represents time in hours.
Determine the rate of change of the population with respect to time, .
Calculate the rate of change of the population at hours. Show your calculations.
Interpret the meaning of your answer to part 2 in terms of the bacteria population growth.
A researcher is analyzing the behavior of a rational function to understand its limits and rates of change.
Evaluate the limit .
Find the derivative using first principles.
Determine the value of .
State the interpretation of in terms of the rate of change of .
Given
Find the derivative of .
Determine the coordinates of the turning points of .
A local environmental organization is studying the growth of a specific plant species, which can be modeled by the function , where represents the number of weeks since planting.
Find the derivative that represents the rate of growth of the plant over time.
Find the gradient of the growth curve at weeks.
Determine the equation of the tangent line to the growth curve at the point where weeks. Give your answer in the form .
Interpret the meaning of the gradient of the tangent line in the context of the plant's growth rate.
The Behavior of Trigonometric Functions Near Zero
Trigonometric functions often behave predictably as they approach certain values, such as zero. Understanding these behaviors is essential in fields like physics and engineering, where sinusoidal functions model wave patterns and oscillations.
Consider the following limit involving a trigonometric function:
Evaluate , showing each step in your working.
Verify your answer to Part 1 by explaining the behavior of as using the small angle approximation.
An electric vehicle's speed and energy efficiency can be modeled mathematically to understand how slight changes in speed affect energy usage.
Consider the function , which estimates the vehicle's energy consumption in kilowatt-hours per 100 kilometers, based on its speed (in kilometers per hour).
Estimate the rate of change of energy consumption with respect to speed when by calculating the average rate of change between and . Show your calculations.
Calculate the exact rate of change of with respect to at using differentiation.
Discuss how the results from parts 1 and 2 are related in the context of energy consumption rates.
In an electrical circuit, the effective resistance (in ohms, ) depends on a dimensionless control parameter . The resistance is modeled by the function:
Engineers analyze this function to understand how the resistance changes as the control parameter approaches zero.
Sketch the graph of for . Clearly label any asymptotes and axis intercepts.
Find and .
Interpret the meaning of the results from Part 2 with reference to the circuit's resistance.
A laboratory is studying the growth of a certain bacteria culture, which follows the exponential growth model given by the equation , where is the time in hours.
Find the rate of change of the population with respect to time, .
Calculate the rate of change of the population when .
Explain the significance of your answer to Part 2.