Practice IB Mathematics Applications & Interpretation (AI) Topic Geometry and Trigonometry with authentic exam-style questions for both SL and HL students. This question bank focuses on the exact syllabus content for Geometry and Trigonometry and mirrors Paper 1, 2, 3 style where relevant.
Get instant solutions, detailed explanations, and build confidence with questions aligned to IB examiner expectations.
A communication system has nodes , and , with directed edges representing signal paths, some with self-loops. The adjacency matrix is:
Draw the directed graph, including self-loops.
Find the number of walks of length 4 from to .
Determine how many distinct nodes are reachable from by a walk of length exactly 5.
A new node is added, with directed edges , , and . Update the adjacency matrix and graph.
In the updated system, find the number of cycles of length 3 including .
A transport network has hubs , and , with directed edges representing one-way routes. The adjacency matrix includes self-loops (hubs retaining cargo):
Draw the directed graph, including self-loops.
Find the number of walks of length 5 from to .
A cargo starts at . List the hubs that can be reached after exactly 4 steps.
A new hub is added with directed edges , , and . Update the adjacency matrix and graph.
In the updated network, find the number of walks of length 3 from to , and interpret in the context of cargo transport.
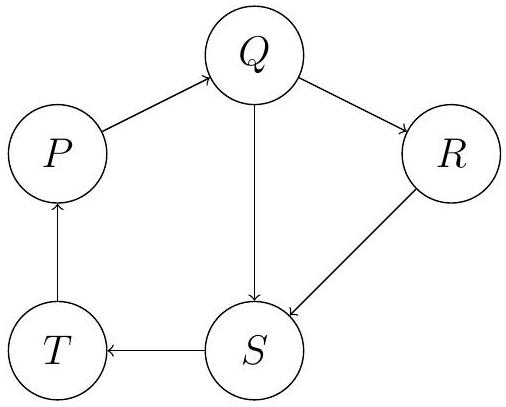
A directed graph models a data network with nodes , and , representing servers, and directed edges indicating one-way data transmission. 
Write down the adjacency matrix for this graph, with rows and columns ordered .
Find the number of distinct walks of length 5 from to .

Determine the number of servers reachable from in exactly 3 steps.
A new server is added. Add directed edges and . Update the adjacency matrix and redraw the graph, with rows and columns ordered .
In the updated network, calculate the number of walks of length 4 from to .
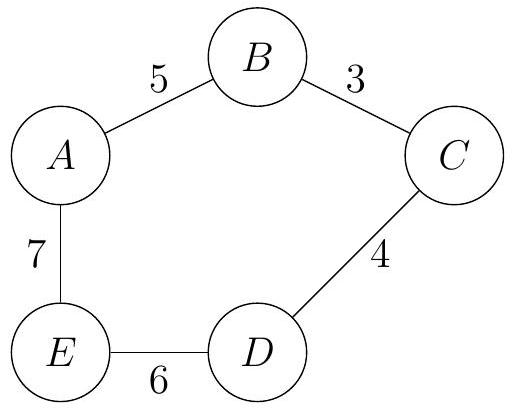
A graph represents a pipeline network with vertices , and edges with weights as maintenance costs (in thousands of USD). The adjacency matrix is:
Draw the weighted graph corresponding to .
Use Prim's algorithm, starting at , to find the minimum spanning tree, indicating the order of edge selection.
A maintenance team must visit all vertices, starting and ending at . Use the nearest neighbor algorithm to find an upper bound for the total cost.
Find a lower bound for the total cost using the MST from Part 1.
If the edge cost increases to thousand USD, find the range of for which remains in the MST.
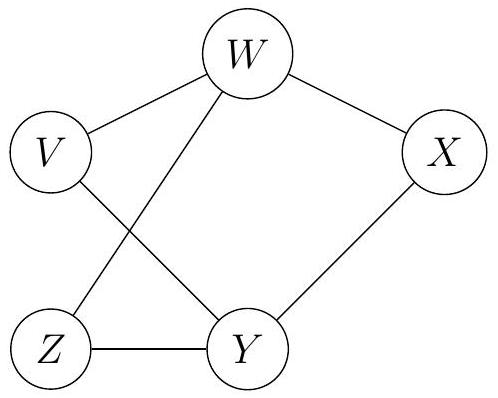
Write down the adjacency matrix for this graph, with rows and columns ordered .
Use Kruskal's algorithm to find the minimum spanning tree (MST), listing the edges in the order they are selected.
Calculate the total distance of the MST.
A delivery van must visit all warehouses, starting and ending at . Use the nearest neighbor algorithm to find an upper bound for the total distance.
Determine a lower bound for the van's total distance using the MST from Part 1.