Practice SL 4.6—Venn diagrams with authentic IB Mathematics Applications & Interpretation (AI) exam questions for both SL and HL students. This question bank mirrors Paper 1, 2, 3 structure, covering key topics like core principles, advanced applications, and practical problem-solving. Get instant solutions, detailed explanations, and build exam confidence with questions in the style of IB examiners.
Consider two events and such that , , and .
Calculate .
Find .
Events and are independent with and .
Find .
Find .
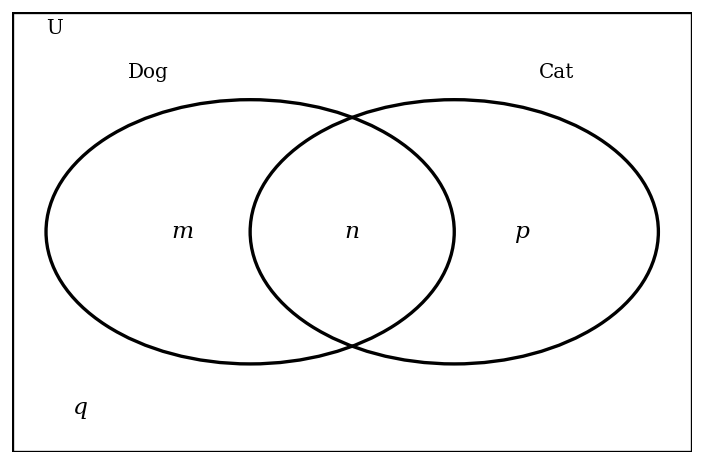
At Mirabooka Primary School, a survey found that 68% of students have a dog and 36% of students have a cat. 14% of students have both a dog and a cat. This information can be represented in the following Venn diagram, where m, n, p and q represent the percentage of students within each region. 
Find the value of m.
Find the value of n.
Find the value of p.
Find the value of q.
Find the probability that a randomly chosen student has a dog but does not have a cat.
Find the probability that a randomly chosen student has a dog given that they do not have a cat.
Tim models the number of school captains appointed in the next 10 years who have a dog using a binomial distribution. Assume one school captain is appointed each year. Use Tim's model to find the probability that in the next 10 years 5 school captains have a dog.
Use Tim's model to find the probability that in the next 10 years more than 3 school captains have a dog.
Use Tim's model to find the probability that in the next 10 years exactly 9 school captains in succession have a dog.
State why Tim should not use the binomial distribution to find the probability that 5 school captains have a dog.
Consider the following sets:
- The universal set $U$ consists of all positive integers less than 15;
- $A$ is the set of all numbers which are multiples of 3;
- $B$ is the set of all even numbers.
Write down the elements that belong to $A \cap B$.
Write down the elements that belong to $A \cap B'$.
Write down $n(A \cap B')$.