Practice SL 2.3—Graph of a function with authentic IB Mathematics Applications & Interpretation (AI) exam questions for both SL and HL students. This question bank mirrors Paper 1, 2, 3 structure, covering key topics like core principles, advanced applications, and practical problem-solving. Get instant solutions, detailed explanations, and build exam confidence with questions in the style of IB examiners.
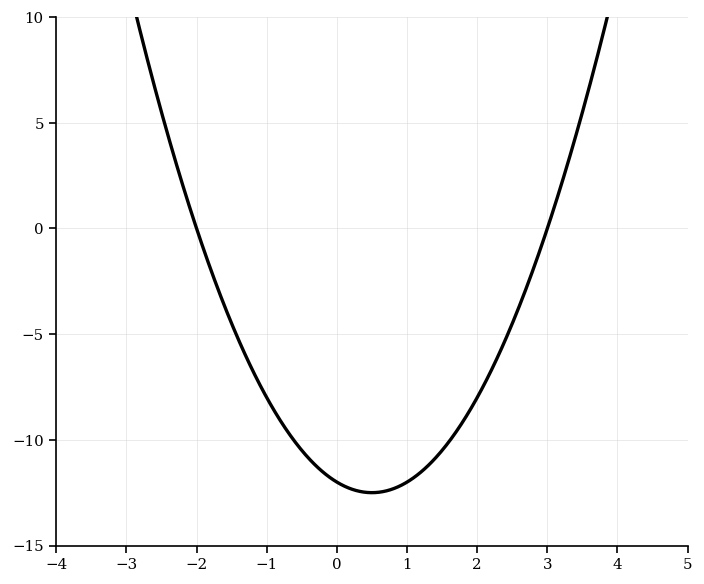
Consider the function . The graph of is shown in the diagram. The vertex of the graph has coordinates . The graph intersects the x-axis at two points, and .

Find the value of .
Find the value of .
Find the value of .
Find the value of .
Consider a quadratic function that has a -intercept of 1, one -intercept at 1, and the -coordinate of its vertex is 3. The equation of the quadratic function is in the form .
Write down the value of .
Write down the second -intercept of the function.
Find the values of and .
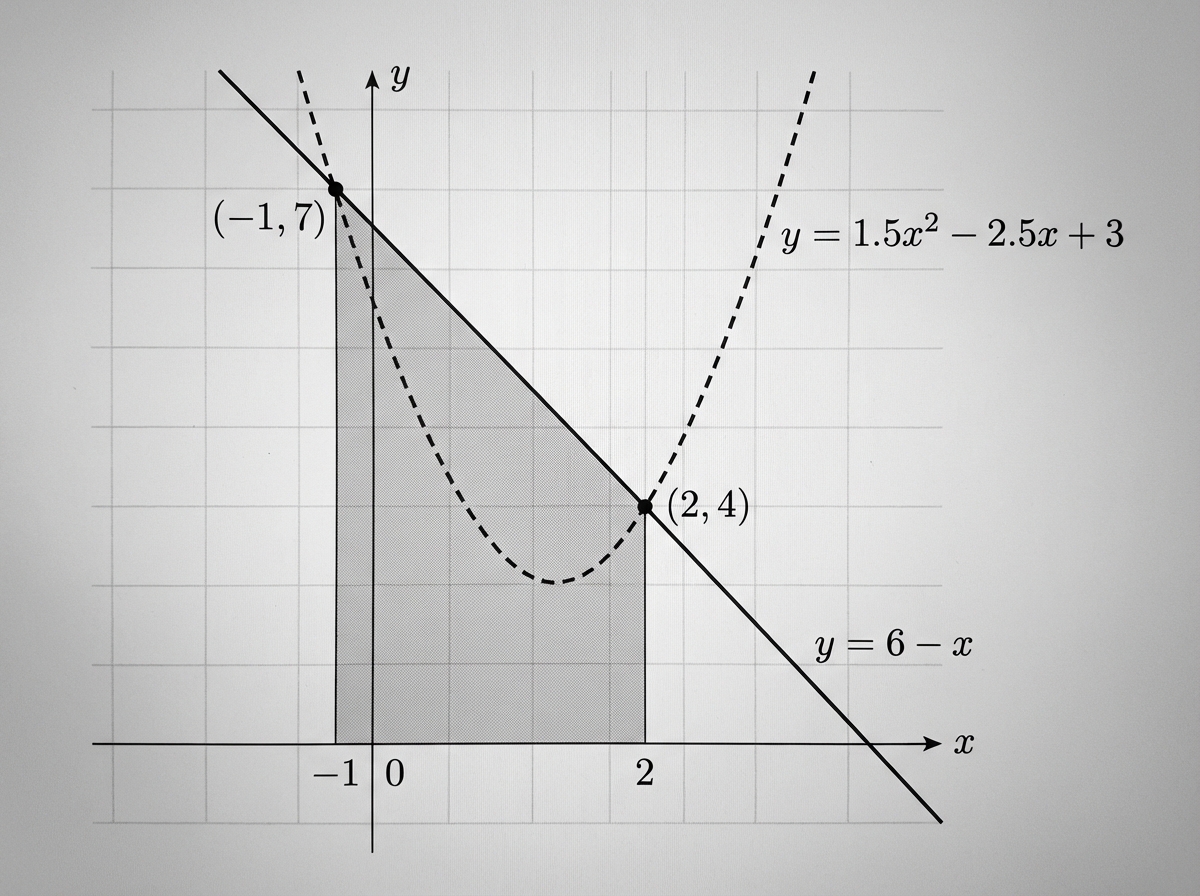
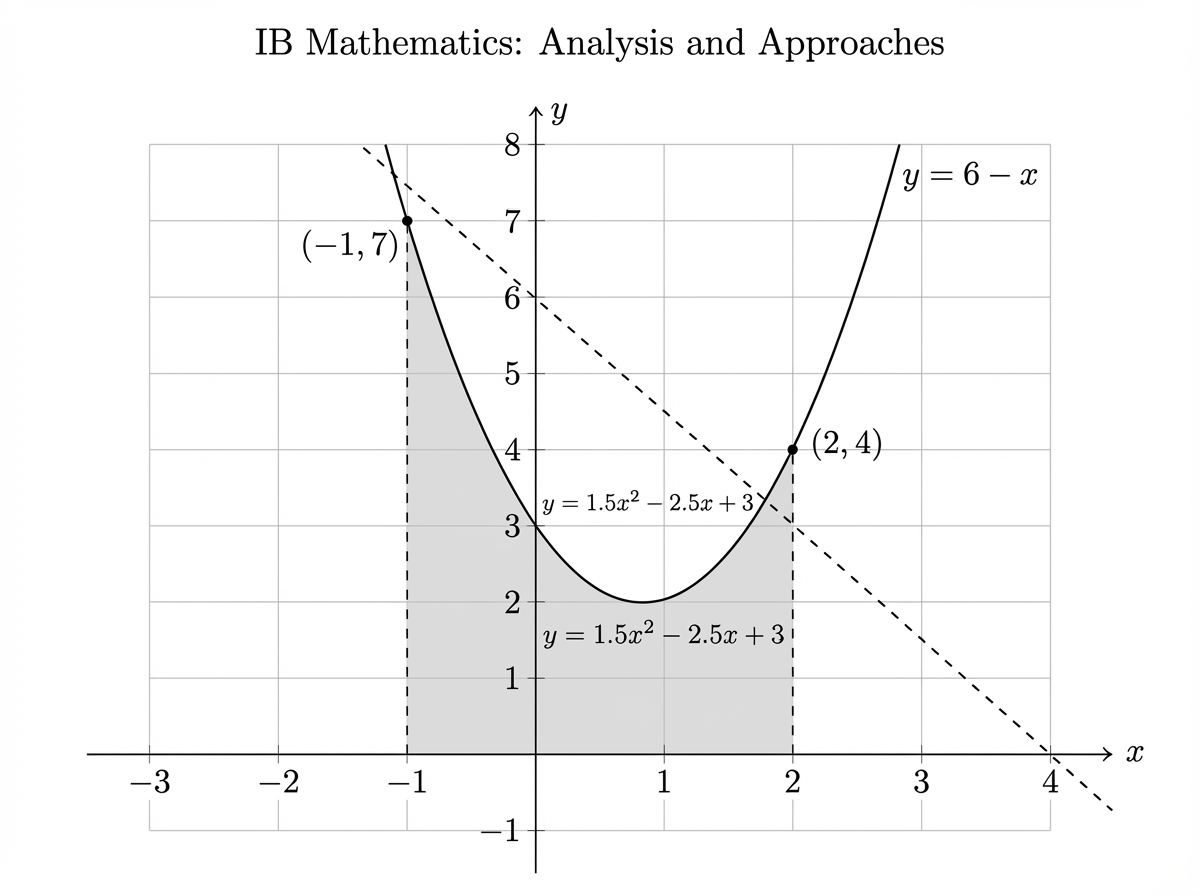
The graphs of and intersect at and , as shown in the following diagrams.
In Diagram 1, the region enclosed by the line , the vertical lines and , and the -axis has been shaded.

In Diagram 2, the region enclosed by the curve , the vertical lines and , and the -axis has been shaded.

Calculate the area of the shaded region in Diagram 1.
Write down an integral for the area of the shaded region in Diagram 2.
Calculate the area of the shaded region in Diagram 2.
Hence, determine the area enclosed between the line and the curve .
The function is defined by , .
Write down the range of .
Find an expression for .
Write down the domain and range of .
A function is defined by for .
Find the range of .
Find the value of .
A music producer is analyzing sound waves and transforms the function by reflecting it over the -axis and stretching it vertically by a factor of 2.
Write the equation of the transformed function.
Sketch the graphs of the original function and the transformed function over the interval .
Describe the effect of the transformation on the amplitude and the period of the sine wave.
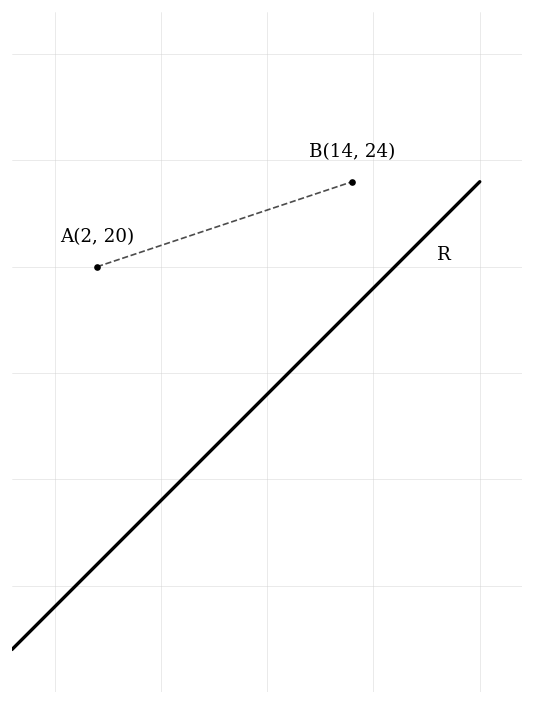
Two schools are represented by points and on the graph below. A road, represented by the line with equation , passes near the schools. An architect is asked to determine the location of a new bus stop on the road such that it is the same distance from the two schools.

Find the equation of the perpendicular bisector of . Give your equation in the form .
Determine the coordinates of the point on where the bus stop should be located.
A civil engineer is designing a parabolic arch for a bridge, which can be expressed in the form . The graph of has an axis of symmetry at and a -intercept at .
Find the value of .
Find the value of .
The line is a tangent to the curve of . Find the value(s) of .
Two towns, and , are connected by a road. Another road runs along the perpendicular bisector of the segment connecting towns P and Q.
Find the equation of this road.
Determine whether it passes through the point .
State whether the bisector is parallel or perpendicular to the -axis or -axis.
A software engineer is developing a function . The graph of is reflected in the line , and the resulting graph is then translated 2 units to the left.
Write the equation of the inverse function before any translation.
Write the equation of the function after it has been translated 2 units to the left.