Practice SL 2.2—Functions, domains, range, graphs with authentic IB Mathematics Applications & Interpretation (AI) exam questions for both SL and HL students. This question bank mirrors Paper 1, 2, 3 structure, covering key topics like core principles, advanced applications, and practical problem-solving. Get instant solutions, detailed explanations, and build exam confidence with questions in the style of IB examiners.
The function is defined by , .
Write down the range of .
Find an expression for .
Write down the domain and range of .
A function is defined by .
Find the range of .
Find an expression for the inverse function . The domain is not required.
Find the range of .
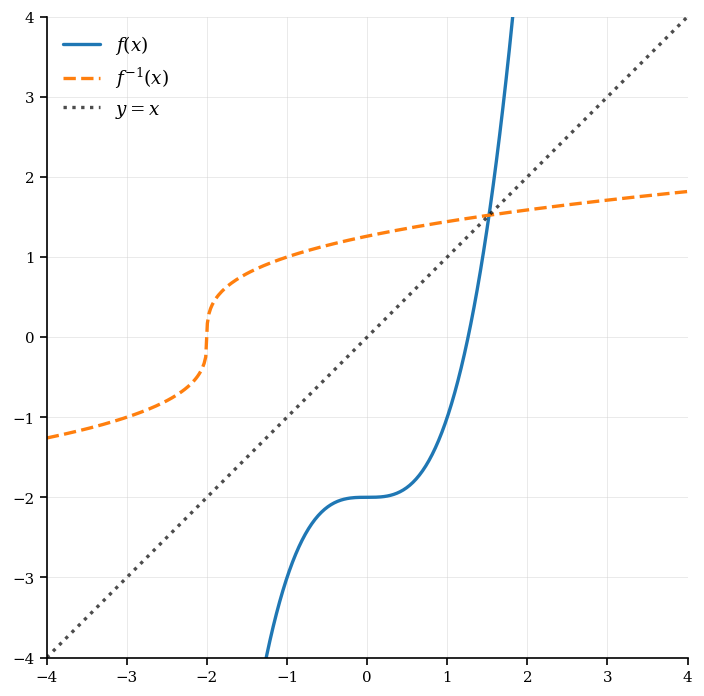
A technology company is developing a new software that predicts user engagement based on a cubic function, modeled by . They are interested in finding the inverse of this function to understand how changes in engagement levels affect user input.
Find the inverse function to determine the input value that corresponds to a specific engagement level.
Sketch the graph of , , and the line on the same axes to visualize the relationship between user engagement and input.

A delivery service is testing the efficiency of a ramp for loading packages onto delivery trucks. The ramp is inclined at an angle of and is long.
Draw a diagram of the ramp showing the slope and label the vertical rise and horizontal run.
Calculate the height of the ramp at its highest point.
If a package has a mass of , find the gravitational force component acting along the ramp (using trigonometry).
If friction is introduced on the ramp, explain how the angle of the slope affects the total force needed to move the package upward.
A startup's profit (in thousands of dollars) for selling units of a product is given by:
Find the domain of the profit function.
Discuss any real-world restrictions on the number of units that can be sold.
Analyze the behavior of as and as .
Consider the function where .
Find the inverse function .
Plot both and on the same set of axes. Use a scale of 1 unit on each axis.
Draw the line on the graph and explain how and are related to this line.
A car's velocity (in m/s) as a function of time is modelled by:
Find the domain of the function .
Explain the physical significance of any restriction in the domain.
Describe what happens to the speed of the car as approaches the values where the function is undefined.
A local environmental organization is studying the net population change of a particular species, which can be modeled by the quadratic function . To better understand the population dynamics, they want to analyze the function's behavior and its inverse.
Restrict the domain of the function so that it is one-to-one, allowing for a clearer analysis of the species' population change.
Find the inverse function to determine the input value that corresponds to a given output in the context of the population change.
Sketch the graph of and on the same set of axes, indicating how the population change relates to its inverse function.
A company's revenue (in thousand dollars) from selling units of a product is modeled by:
Find the range of the revenue function .
Discuss the maximum possible revenue as increases indefinitely.
What does the lower bound of the range represent in terms of sales?