
A tectonic plates moving diagram shows how lithospheric plates interact at divergent, convergent, and transform boundaries. Arrows reveal direction; labels connect movement to rifting, subduction, crust creation or recycling, earthquakes, and volcanism. For IB DP Geography, the strongest diagrams do more than name a boundary: they explain the process and resulting hazard.
A diagram can look simple enough to memorize in a minute. Yet that simplicity is deceptive. Two arrows may represent millions of years of movement, while one descending line can explain trenches, earthquake depths, volcanic arcs, and tsunami risk.
The goal is not artistic perfection. It is causal clarity.
What your plate movement diagram must show
Before exploring each boundary, use this quick checklist:
- Draw clear arrows showing relative plate movement.
- Name the boundary using accepted terminology.
- Distinguish oceanic and continental lithosphere where relevant.
- Label rifting, subduction, a fault, or new crust formation.
- Connect the process to earthquakes, volcanoes, or both.
- Add a named location when the question invites an example.
- Explain the diagram in words rather than expecting it to earn every mark alone.
Plate movement belongs within Option D: Geophysical Hazards, particularly the study of geophysical systems. The syllabus coverage includes internal heating, convection currents, plumes, subduction, and rifting at plate margins. RevisionDojo's IB Geography Geophysical Systems resources provide a useful route from those mechanisms to their associated hazards.
How tectonic plates move
Tectonic plates are rigid sections of the lithosphere moving relative to one another over hotter, more deformable mantle material. Their motion is slow, but friction and deformation at their boundaries allow enormous stress to accumulate.
For IB answers, avoid presenting mantle convection as a perfectly circular conveyor belt that simply carries plates. Internal heat contributes to mantle motion, while processes associated with sinking slabs, spreading ridges, rifting, and mantle plumes form part of the wider system. A diagram is necessarily a model, so its arrows simplify a more complex three-dimensional process.
This distinction matters because an explain question requires mechanism. Saying “convection currents move the plates” is usually less convincing than building a sequence:
Internal heat and mantle motion create forces within the tectonic system; plates move relative to one another; stress or decompression develops at their margins; energy or magma is released; a geophysical event follows.
Students needing the wider hazard context can review the Option D Geophysical Hazards notes.
Reading the three main plate boundaries
Divergent boundaries
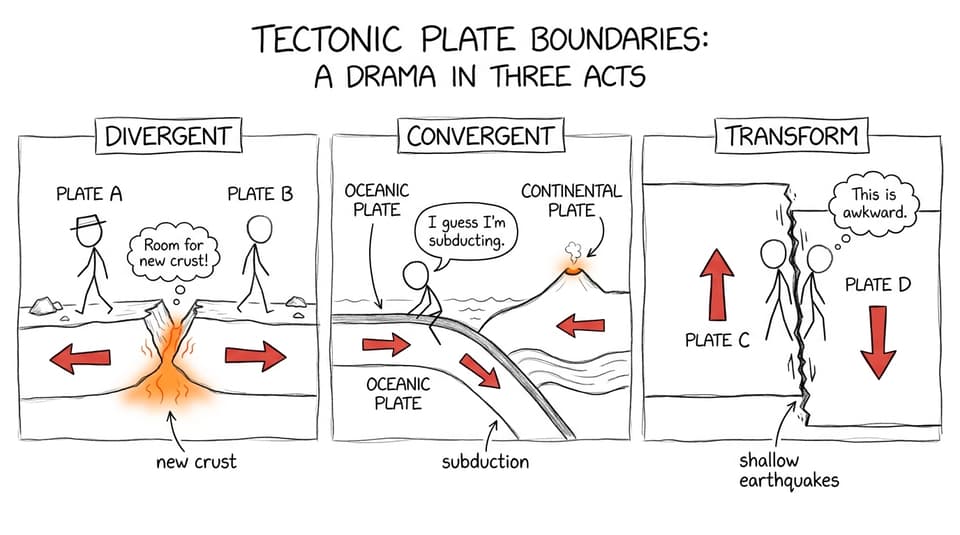
At a divergent, or constructive, boundary, plates move apart. Reduced pressure allows mantle material to melt, magma rises through fractures, and cooling material forms new crust. Oceanic examples produce mid-ocean ridges, while continental divergence can create rift valleys.
Your diagram should include:
- arrows pointing away from the boundary
- rising magma
- a central ridge or rift
- newly formed crust
- shallow-focus earthquakes and volcanic activity
The Mid-Atlantic Ridge is a standard geographical example. The important point is not merely its name, but why it exists: plates diverge and magma rises into the space created.
Convergent boundaries
At convergent boundaries, plates move towards one another. What happens next depends on the lithosphere involved.
Where an oceanic plate meets a continental plate, the denser oceanic lithosphere descends at a subduction zone. A strong diagram should show the ocean trench, descending slab, earthquake foci along the subduction zone, rising magma, and volcanoes on the overriding plate. The Nazca Plate subducting beneath the South American Plate is a useful located example.
Oceanic-oceanic convergence can also cause subduction, producing a trench and volcanic island arc. At continental-continental collision zones, neither plate subducts easily. Compression thickens, folds, and uplifts the crust, creating major mountain systems and earthquakes but little typical subduction-related volcanism.
The full relationship between margins and hazards is developed in How Tectonic Plate Boundaries Create Hazards.
Transform boundaries
At a transform, or conservative, boundary, plates slide laterally past one another. Crust is neither created nor destroyed. Friction can temporarily lock parts of the fault, allowing stress to accumulate before sudden movement releases seismic energy.
Show opposite parallel arrows, a near-vertical fault, and shallow earthquake foci. Do not draw rising magma or a volcanic arc unless another tectonic setting independently explains it. The San Andreas Fault system between the Pacific and North American plates is a familiar example.
Quick-reference tectonic plates moving diagram table
| Boundary | Arrow pattern | Main process | Typical features and hazards |
|---|---|---|---|
| Divergent | Away from boundary | Rifting and new crust formation | Ridge or rift, volcanism, shallow earthquakes |
| Oceanic-continental convergent | Towards boundary, with oceanic plate descending | Subduction | Trench, volcanic arc, shallow-to-deep earthquakes, possible tsunami |
| Continental collision | Towards boundary | Compression and crustal uplift | Fold mountains and earthquakes, limited volcanism |
| Transform | Parallel movement in opposite directions | Friction, locking, and sudden slip | Faulting and shallow earthquakes; no routine volcanic arc |
Do not memorize this table as four disconnected rows. Build links between movement, process, landform, and hazard. RevisionDojo's Geophysical Hazards Questionbank helps turn those links into retrievable exam knowledge.
How diagrams appear in IB Geography questions
A plate diagram may be supplied as a stimulus, requested directly, or used voluntarily to support an explanation. In every case, begin with the command term. The IB exam command terms guide explains the difference between tasks such as describe, explain, and annotate.
- Describe means identify visible characteristics or patterns.
- Explain means give reasons or causes and connect them logically.
- Annotate means add brief explanatory notes, not isolated labels.
- Compare means refer to both boundaries throughout the response.
A useful answer sequence is:
movement --> tectonic process --> physical feature --> hazard
Worked practice example
Practice prompt: Explain how movement at an oceanic-continental convergent boundary generates geophysical hazards.
Step one: identify the required process. The answer needs more than a description of two approaching plates. It must explain how convergence creates hazards.
Step two: sketch and annotate. Draw the denser oceanic plate descending beneath the continental plate. Add inward arrows, a trench, earthquake foci, rising magma, and volcanoes on the overriding plate.
Step three: write the causal chain.
The oceanic and continental plates converge. The denser oceanic lithosphere is forced beneath the continental lithosphere at a subduction zone. Friction may lock the plate interface, allowing stress to accumulate until sudden slip releases seismic energy as an earthquake. Displacement of the seabed during a major submarine earthquake may generate a tsunami. Magma formed within the subduction system can rise through the overriding plate, producing volcanic activity.
Step four: locate the process. Add the Nazca and South American plates as an example, provided it is relevant to the exact wording.
Notice what makes the response effective: every sentence advances the mechanism. For broader response planning, use RevisionDojo's guide to structuring IB answers for maximum marks.
Common mistakes that weaken plate diagrams
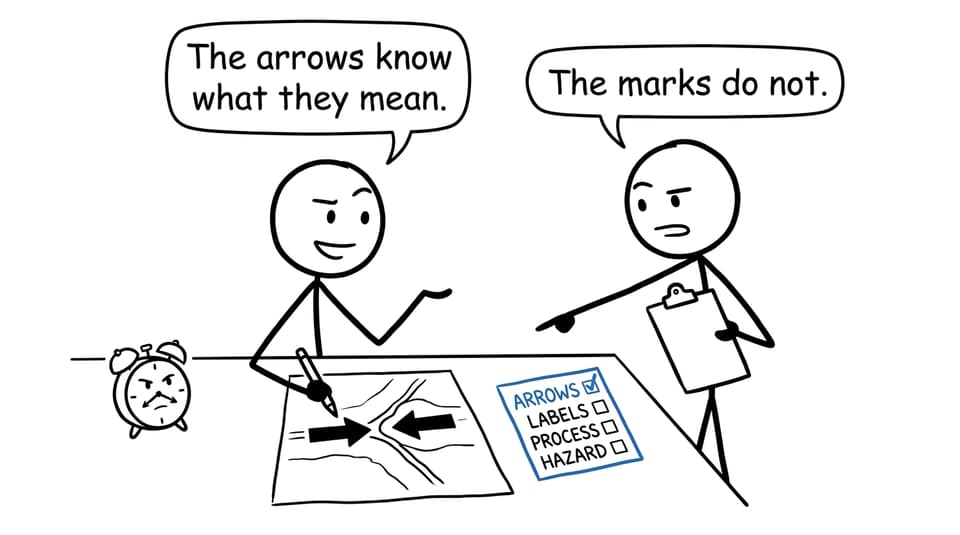
Drawing arrows without explaining them
Arrows show direction, not cause or consequence. Label the process and explain what it produces.
Treating every convergent margin as identical
Oceanic subduction, oceanic-oceanic subduction, and continental collision create different landforms and volcanic patterns. Identify the plate types before drawing the outcome.
Placing volcanoes at transform boundaries
Transform movement commonly produces shallow earthquakes, but it does not normally create the magma pathway responsible for a volcanic arc.
Drawing the continental plate beneath the oceanic plate
At a typical oceanic-continental subduction zone, the denser oceanic lithosphere descends. Make the oceanic plate visibly thinner and label it.
Listing features instead of explaining a system
A trench, volcano, and earthquake are not three unrelated labels. Show how convergence causes subduction, how stress release causes earthquakes, and how magma reaches the overriding plate.
Ignoring scale and readability
Use large arrows, straight label lines, and uncluttered annotations. A small diagram crowded into a paragraph may be scientifically accurate yet difficult to interpret.
A practical revision routine
Redraw each boundary from memory in under two minutes. Then cover it and write one causal chain beneath it. Check your work against the RevisionDojo IB Geography resource hub, convert forgotten labels into Flashcards, and apply the process using Questionbank prompts.
Once the content is secure, move to timed IB Geography Predicted Papers or Mock Exams. Use AI Chat when a mechanism remains unclear and Grading tools to identify whether an answer is descriptive rather than explanatory. RevisionDojo also brings Study Notes, a Coursework Library, and Tutors into the same wider IB support system.
From arrows to explanation
A good plate diagram is a compressed argument. It tells the examiner where plates move, what physical process follows, and why a particular hazard occurs.
That is the shift worth practising: from recognizing a picture to explaining a system. Build the diagram, annotate the mechanism, test it under time pressure, and use RevisionDojo to turn every missing label or broken causal link into your next focused revision task.