

If you have ever stared at a scatterplot and felt a small surge of pride because your curve “looks right,” you already understand the most dangerous moment in modeling.
Because in IB, a model that looks right can still be wrong.
Examiners are not only asking whether you can create a regression or function. They are asking whether you can trust it. That is what evaluating model fit is really about: proving, with statistical tools, that your model earns the right to be believed.
This guide shows IB students how to evaluate model fit with the same calm logic you want to have in an exam or in your Math IA. We will use residual analysis, R², MAE, RMSE, correlation, and the “so what?” explanations that turn numbers into marks.

A quick checklist IB examiners reward
Before you evaluate model fit, make sure you can do these quickly:
-
State your model clearly (equation + what variables mean).
-
Plot data and model together (visual fit check).
-
Compute residuals and describe their pattern.
-
Report at least one fit statistic (often R²) and one error statistic (MAE or RMSE).
-
Interpret results in context (units, scale, reasonableness).
-
Reflect on limitations: outliers, range, assumptions, overfitting.
If you are building this inside your IA workflow, pair this post with How to Build Mathematical Models for the IB Math IA so your evaluation matches how you built the model in the first place.
Why model fit matters in IB (and why “high R²” is not enough)
In IB Maths, especially in Applications and Interpretation, regression is never treated as magic. It is treated as an approximation--a claim about the world that needs evidence.
A good evaluation of model fit does three things:
-
It tests reliability: are predictions consistently close to observed values?
-
It checks bias: does the model systematically overestimate or underestimate?
-
It proves understanding: you are not just pressing buttons; you are judging quality.
If you want the deeper intuition behind why the line almost never fits perfectly, read Why Do Regression Models Never Fit Perfectly in IB Maths?. It pairs perfectly with what comes next.
The core statistical tools to evaluate model fit (IB-friendly)
Residual analysis (the examiner’s favorite truth serum)
A residual is the gap between what you observed and what your model predicted:
Residual = observed value - predicted value
Residual analysis matters in IB because it answers a question R² can hide: is there a pattern in the errors?
How to use residuals well:
-
Compute residuals for each point.
-
Plot residuals against the independent variable (or against predicted values).
-
Look for randomness around 0.
What “good” looks like: residuals scattered above and below 0 with no curve, no funnel shape, no clusters.
What “bad” looks like:
-
A curved pattern (suggests a non-linear relationship).
-
A funnel shape (variance increases with x, often called heteroscedasticity).
-
One point with a massive residual (possible outlier or measurement issue).
For a full IB-style explanation of why residuals often matter more than the equation, use Why Residual Analysis Is More Important Than the Regression Equation.
Coefficient of determination (R²)
R² measures how much variation in the dependent variable is explained by the model:
R² = 1 - (SS_res / SS_tot)
-
R² = 1 means perfect fit (rare in real data).
-
R² close to 0 means the model explains little.
In IB writing, the key is not just stating “R² is high.” The key is saying what it implies.
Examiner-ready interpretation template:
“An R² of 0.89 suggests the model explains about 89% of the variability in ____, so the overall trend is strong within the observed range. However, residual analysis is still required to check for systematic bias.”
If you need a quick refresher on the least squares idea behind these statistics, Non-linear Regression Notes (AHL 4.13) is a clean reference.
Mean Absolute Error (MAE)
MAE tells you the typical size of your errors:
MAE = (Σ |observed - predicted|) / n
MAE is IB-friendly because it is intuitive. It stays in the same units as your data, so you can interpret it in plain language.
How to explain MAE in IB:
“The MAE is 2.3 cm, meaning the model’s predictions are typically about 2.3 cm away from the measured values.”

Root Mean Square Error (RMSE)
RMSE is similar to MAE but penalizes large errors more:
RMSE = sqrt( Σ(observed - predicted)² / n )
Use RMSE when you want a metric that reacts strongly to outliers or occasional big misses.
IB interpretation hint: If RMSE is much larger than MAE, that often means a few large errors are pulling it up. That is a great moment to talk about influential points or measurement noise.
Correlation coefficient (r)
Pearson’s r measures strength and direction of a linear relationship:
-
r close to 1: strong positive linear association
-
r close to -1: strong negative linear association
-
r close to 0: little linear association
In IB, correlation helps, but it never replaces residual analysis, and it never proves causation.
If you want an easy reminder of how to phrase correlation well, see AP Statistics Regression and Correlation Tips (the phrasing is still highly useful for IB-style writing).
How to combine tools into one strong IB evaluation paragraph
A reliable structure is:
-
Visual fit: does the curve track the data broadly?
-
Residual check: any patterns or bias?
-
Fit statistic: R² for explained variation.
-
Error statistic: MAE or RMSE for typical prediction error.
-
Reflection: limitations and what you would try next.
Example paragraph you can adapt:
“The quadratic regression captures the overall trend in the dataset, particularly in the mid-range of x. Residuals are mostly scattered around 0 with no strong pattern, suggesting the model is not systematically biased, although two high-x values show larger positive residuals. The R² value of 0.91 indicates the model explains approximately 91% of the variation in y. The MAE of 1.8 units suggests predictions are typically within 1.8 units of observed values, which is reasonable given the measurement precision. However, the larger residuals at the upper end imply the relationship may change beyond the observed range, so extrapolation would be unreliable.”
That is the IB balance: confidence without overclaiming.
Common IB mistakes when evaluating model fit
Treating R² like a final grade
A high R² can still hide a curved residual pattern. IB rewards students who say, “R² is strong, and here is what residuals show.”
Ignoring units when reporting error
MAE = 2.3 is meaningless unless you say 2.3 what. IB clarity is mathematical communication.
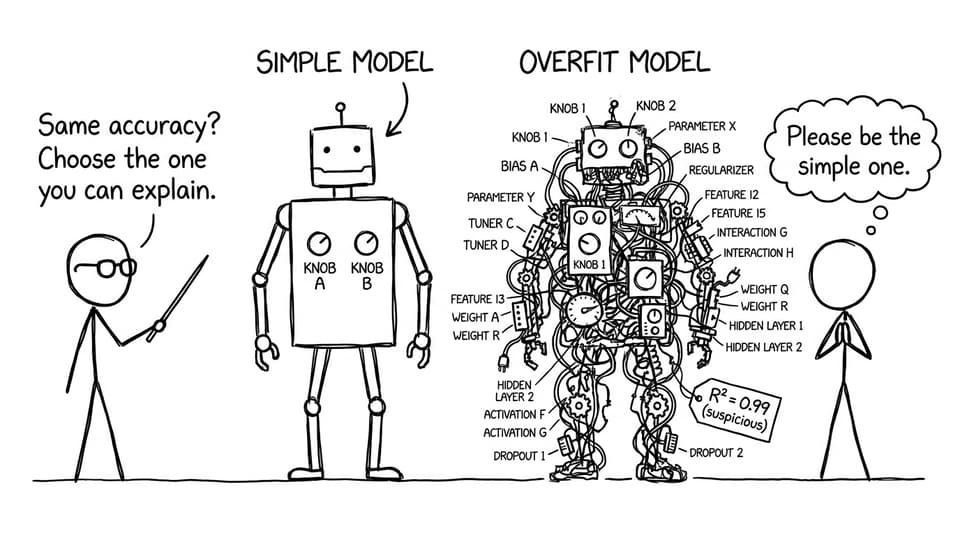
Overfitting to chase perfection
If you add complexity just to raise R², you may create a model you cannot justify. IB prefers a model you can explain and defend.
Copying calculator output without interpretation
Calculator numbers do not earn marks. Your explanation does.
If you are polishing an IA draft, it can help to compare your approach with How to Avoid Common Mistakes in IB Math IA Modeling.
How RevisionDojo helps IB students evaluate model fit faster
This is the part most students underestimate: evaluation is not just computation. It is workflow.
RevisionDojo is built for that workflow across both exams and coursework:
-
Study Notes to relearn residuals, regression, and interpretation language quickly.
-
Flashcards to make formulas (MAE, RMSE, R²) automatic under time pressure.
-
AI Chat to ask, “How do I interpret this residual plot in IB terms?” and get rubric-aware phrasing.
-
Questionbank to drill regression questions until you can explain fit, not just find it.
-
Mock Exams and Predicted Papers to practice writing evaluation under exam constraints.
-
Grading tools (especially for coursework) to check whether your reflection and evaluation sound like an examiner.
-
Coursework Library to see what strong evaluation paragraphs look like in real exemplars.
-
Tutors when you want a human to pressure-test your reasoning.
Useful starting points:
Conclusion: IB model fit is trust, not decoration
A model is a story about reality. In IB, you do not get marks for telling the story confidently. You get marks for proving the story holds up when tested.
Evaluate model fit with residual analysis, R², MAE/RMSE, and clear interpretation. Make the model earn your belief. Then write that judgment with calm precision.
When you want to practice the full loop--learn the tools, apply them to exam questions, and get feedback that sounds like an IB examiner--RevisionDojo brings it together with Study Notes, Flashcards, AI Chat, the Questionbank, Grading tools, Mock Exams, Predicted Papers, the Coursework Library, and Tutors.
IB students do not need more math panic. They need a system. RevisionDojo is that system.