

Why regression never feels “perfect” (and why that’s the point)
You plot the data. You run the regression. The calculator draws a neat line or curve.
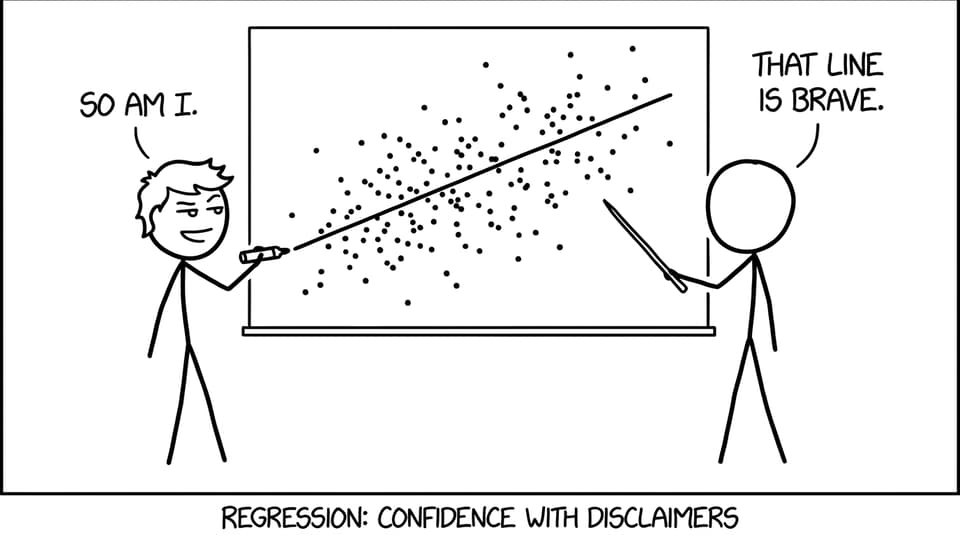
Then you notice it: half the points are floating above it, some are below, and one point is basically in another universe.
In IB Math, that moment can feel unsettling because so much earlier mathematics trained you to expect clean rules: if there’s an equation, it should hit the points. Regression is where IB quietly changes the deal. A regression model is not a promise. It’s a negotiated truce between a messy world and a simple function.
Quick checklist: what examiners want when fit isn’t perfect
Before you panic about scatter in IB Math, run this checklist:
-
State that the model is an approximation of the trend.
-
Mention variability (measurement error, natural spread, uncontrolled factors).
-
Use fit language like “reasonably fits,” “shows an overall trend,” or “limited reliability.”
-
Refer to residuals/outliers if asked to evaluate suitability.
-
Avoid causal claims unless the context clearly supports it.
For targeted drills on exactly this wording, the Regression Line Questionbank practice is one of the fastest ways to build exam instincts.
What a regression model is actually doing in IB Math
A regression model is trying to capture typical behaviour, not individual perfection.
Most regression methods choose parameters that minimize overall error (often the squared residuals). That means the model is designed to be a “best compromise” through the cloud of points, not a line that touches every dot.
This is central to IB Math Applications and Interpretation, where the skill is not just producing an equation, but interpreting what that equation can and cannot claim. If you want the syllabus-aligned overview of where this sits, start at the IB Math AI hub.
To deepen the concept from a different angle, read Why Is Linear Regression Easy to Calculate but Hard to Explain in IB Maths.
Why real-world data refuses to line up
In IB Math, imperfect fit is usually evidence that your data is realistic.
Here’s why points spread out:
-
Measurement error: tools and people are inconsistent.
-
Natural variation: even “same” conditions rarely produce identical outcomes.
-
Missing variables: the model only uses x and y, but reality uses everything.
-
Simplifying assumptions: linear or exponential models ignore complexity.
Oddly, a model that fits perfectly can be a warning sign: it may be overfitted, cherry-picked, or based on too few points to be trustworthy. That’s why IB often rewards cautious judgement more than pretty graphs.
The trap: confusing “best fit” with “true”
A regression can be mathematically correct and still be a poor choice.
In IB Math, you’re expected to ask: does this model make sense in context? Could it be non-linear? Is extrapolation happening? Are there outliers pulling the line?
Residual thinking matters here. If you haven’t trained that skill yet, Why Residual Analysis Is More Important Than the Regression Equation is the cleanest way to upgrade your evaluation marks.
Correlation, outliers, and the “too confident” sentence
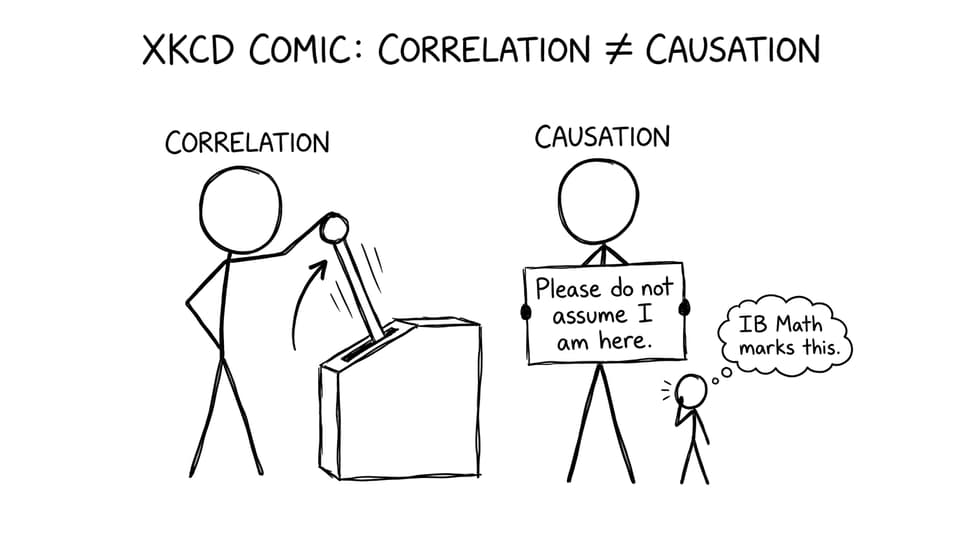
A high correlation value can make students overconfident in IB Math. But correlation measures association, not certainty.
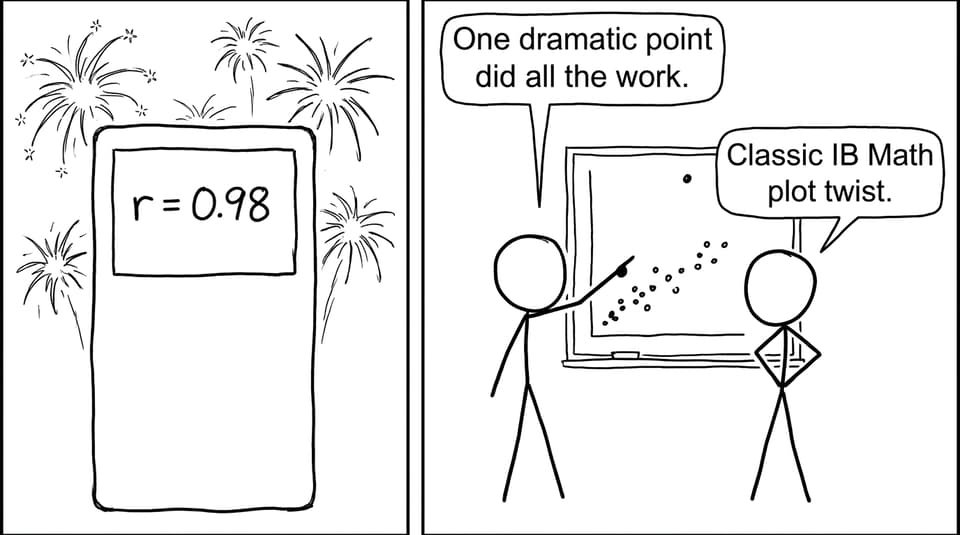
One outlier can inflate or distort correlation and tilt the regression line. Strong correlation can still lead to weak prediction, especially if you extrapolate or ignore hidden variables.
Two useful reads to sharpen your exam commentary:
How to turn “scatter” into marks in IB Math
When a question asks you to comment on fit, you don’t need a speech. You need examiner-style restraint.
Try templates like these:
-
“The regression model shows a general trend, but there is noticeable scatter, so predictions may be unreliable.”
-
“The relationship appears approximately linear, though an outlier may be influencing the model.”
-
“Interpolation within the data range is more reliable than extrapolation beyond it.”
Then practice making those sentences feel natural under time pressure. RevisionDojo helps because you can combine Study Notes with immediate drilling in the Questionbank, lock in the phrasing with Flashcards, and use AI Chat to refine your explanation until it sounds like the markscheme.
If you want an exam workflow for tech-based questions, How to Interpret Data in IB Math AI Using Technology pairs well with regression practice.
Closing: imperfect fit is a feature, not a flaw
Regression models never fit perfectly in IB Math because the world isn’t perfectly mathematical. The purpose of regression in the IB is to teach you how to reason when certainty disappears: to describe trends, evaluate reliability, and communicate limits like a scientist.
If you want to turn that skill into consistent marks, build a loop: learn the idea in Study Notes, drill it in the Questionbank, test yourself with Mock Exams, and use Grading tools plus AI Chat to polish your explanations. That’s the RevisionDojo advantage: not just doing regression, but explaining it the way IB rewards.