
Modeling in an IB Math IA has a strange power: it can make an ordinary topic feel intelligent, or make a genuinely good investigation look like a calculator printout with a story taped on.
Most students don’t lose marks because they “don’t understand modeling.” They lose marks because their modeling choices don’t look intentional to an examiner. The function is picked too early. The parameters aren’t explained. The fit is celebrated, but never questioned.
This guide shows you how to avoid the most common IB Math IA modeling mistakes while keeping your exploration clear, realistic, and examiner-friendly. Along the way, you’ll see how RevisionDojo helps you turn raw regression into reasoning.
A quick checklist before you build any IB model
Use this as your two-minute pre-flight check. In an IB Math IA, it saves hours later.
-
Plot the data first (don’t choose the model in your head).
-
Define variables with units and realistic ranges.
-
Test at least two plausible model types.
-
Evaluate fit using visuals and residual thinking (not just one number).
-
Justify the final model choice in plain language.
-
Validate with a quick prediction check.
-
Present graphs like an examiner will read them.
If you want a bigger modeling framework, start with How to Build Mathematical Models for the IB Math IA.
The most common IB modeling mistake: choosing the model too soon
In many IB Math IAs, the first real mistake happens before any math appears on the page: the student falls in love with a model type.
Linear feels safe. Exponential feels impressive. A polynomial feels like you’re “doing more math.” But the data doesn’t care what feels impressive.
A better approach is boring in the best way:
-
Make a scatter plot.
-
Describe what you see (growth, saturation, periodicity, diminishing returns).
-
Pick two or three candidate models that match that shape.
If you’re stuck at the topic stage, The Best IB Math IA Topics for 2025 is useful because it quietly pushes you toward questions that naturally generate model-able data.
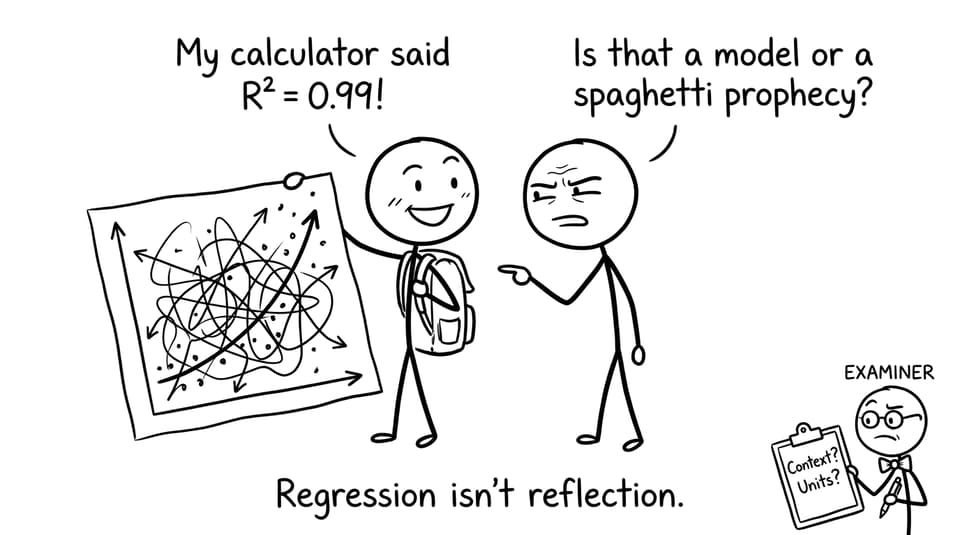
Don’t outsource thinking to regression outputs (even in IB)
Regression tools are helpful. In an IB Math IA, they’re also a trap.
If your write-up reads like:
-
“I used regression and got y = 2.13e^0.41x.”
-
“The R² was high, so the model is good.”
…you’ve shown calculation, but not modeling.
What examiners want is interpretation. Your parameters must mean something in the real situation. For example:
-
What does the growth rate represent per unit of x?
-
Is the intercept meaningful, or is it an artifact of how you defined x?
-
If the parameter changes slightly, what changes in the real world?
RevisionDojo helps students practice that translation from algebra to explanation. The IB IA Guides hub is a good starting point when you want rubric language that matches what examiners reward.
IB Math IA modeling needs context, not just curves
A model can be numerically accurate and still feel wrong in an IB IA if it ignores context.
Ask yourself:
-
Does the model make sense outside the measured range?
-
Does it predict impossible values (negative time, negative mass, infinite growth)?
-
Are you implicitly assuming the world stays constant (same conditions, same behavior)?
This is where strong IAs add a short “reality check” paragraph. It’s not filler. It’s modeling.
If you want a clear way to connect math and reality, How to Connect Mathematical Theory to Real-World Contexts in the IB Math IA is a helpful reference.
Misreading fit: why IB examiners don’t worship R²
A high R² can be comforting. In an IB Math IA, comfort is not the same as quality.
R² tells you one thing: how much of the variation is explained by the model for that dataset. It does not tell you:
-
whether the relationship is causal,
-
whether the model violates assumptions,
-
whether outliers are driving the fit,
-
whether a different model would be more meaningful.
So do the simple checks:
-
Look at residuals (even informally). Do errors seem random or patterned?
-
Identify outliers and explain whether they’re mistakes, rare events, or meaningful exceptions.
-
Compare at least one alternative model type.
If your data stage feels messy, How to Use RevisionDojo to Prepare for IB Math IA Data Analysis pairs well with this step.
Weak justification: the silent mark killer in IB modeling
Many IB students do test multiple models but never clearly justify the final choice. The IA then reads like you “arrived” at the model by accident.
A good justification has two layers:
-
Data behavior: “The graph increases quickly then slows, suggesting diminishing returns.”
-
Mathematical behavior: “A logarithmic function increases at a decreasing rate, matching this trend better than a polynomial, which can oscillate.”
Want to see what that sounds like when it’s done well? Use Using IA/EE Exemplars to Improve Your IB Math IA to borrow the tone of a high-scoring explanation without copying the content.
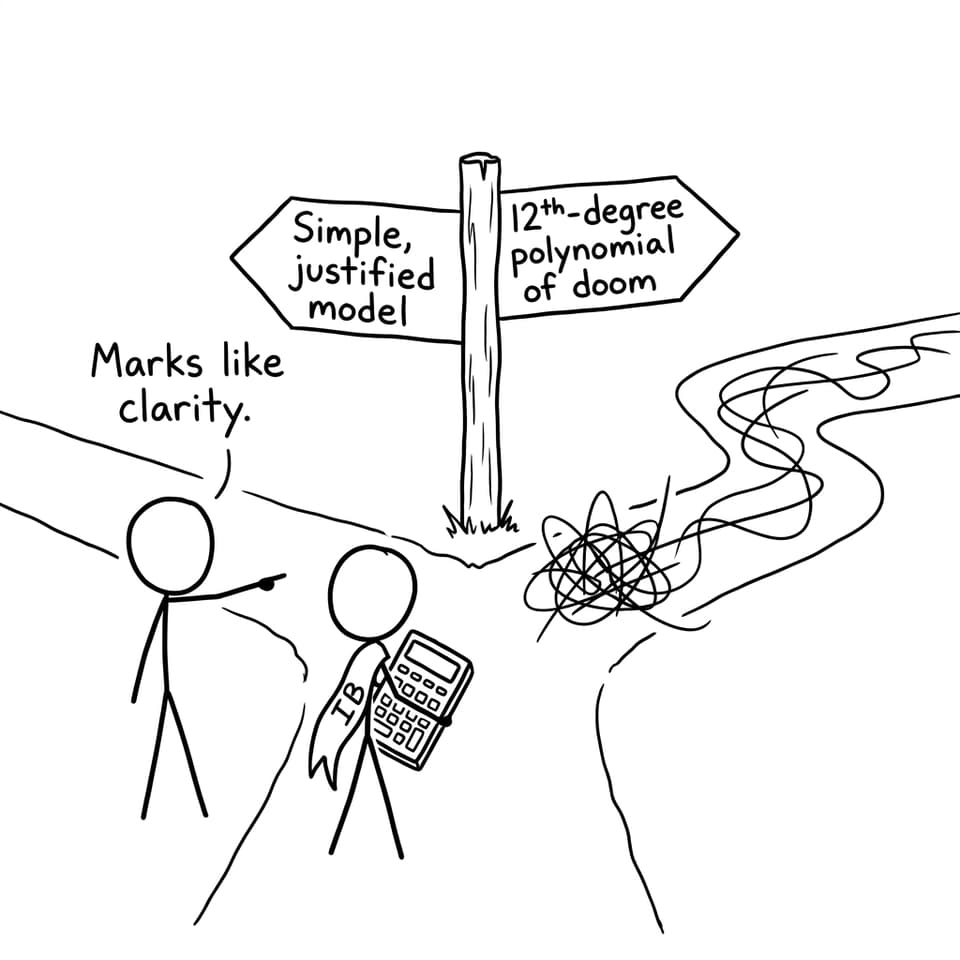
Overcomplicating the math: when “harder” scores lower in IB
There’s a particular IB Math IA phase most students go through:
“If I use a higher-degree polynomial, it will look more advanced.”
Sometimes it does look advanced. More often it looks like curve-fitting without insight.
A simple model with clean reasoning usually beats a complicated model you can’t explain. Examiners reward:
-
appropriate mathematics,
-
correct mathematics,
-
reflective mathematics.
If you want extra technical practice for the skills behind modeling (functions, calculus, regression thinking), RevisionDojo’s Questionbank is built for targeted drills, like IB Mathematics AA Resources and its Calculus Questionbank.
Skipping validation: the IB model that predicts nonsense
Validation sounds formal, but in an IB Math IA it can be simple and powerful:
-
pick a realistic input value,
-
compute the output using your model,
-
compare with a known value (or a held-out data point),
-
comment on the difference.
Even a short “prediction vs actual” table can lift your reflection because it shows your model is not just a curve, but a tool.
If you use simulations as part of validation, How to Incorporate Simulations in Mathematical Modeling gives a clear structure.
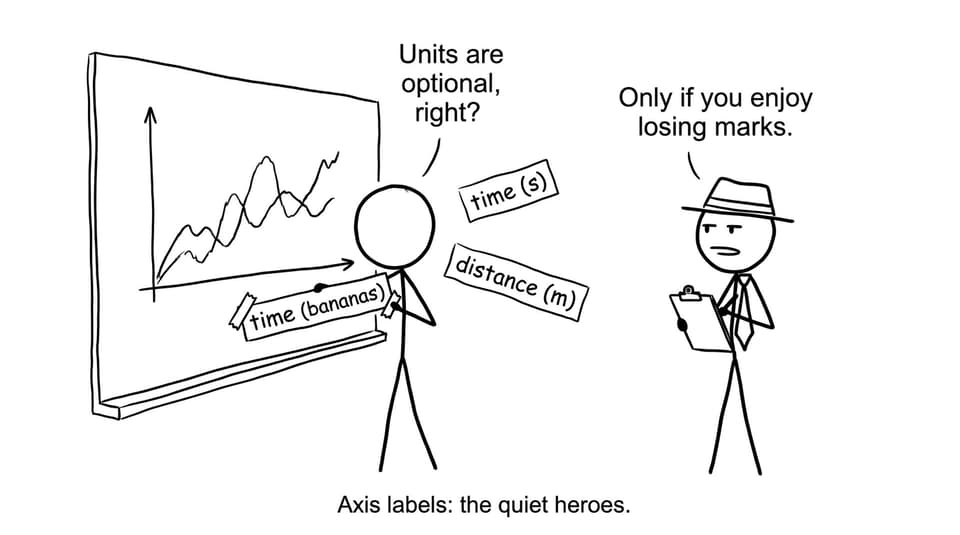
Presentation mistakes: how IB graphs quietly lose marks
In an IB IA, graphs are evidence. If the evidence is messy, the argument feels shaky.
Make sure every graph has:
-
a descriptive title,
-
labeled axes with units,
-
a readable scale that shows the trend,
-
clear distinction between raw data and model curve,
-
consistent notation (don’t rename variables mid-way).
Good presentation also supports your modeling narrative: “Here is the data, here is what I noticed, here is the model, here is what it means.”
Closing: turn IB modeling into a story an examiner can follow
The best IB Math IA models don’t feel like magic tricks. They feel like decisions.
You start with data. You notice a pattern. You test options. You justify a choice. You check whether it holds up. And you admit, clearly, where reality refuses to behave like a clean function.
If you want to build that kind of examiner-ready workflow, RevisionDojo is designed for it: Study Notes for the underlying concepts, Flashcards to keep methods fresh, a targeted Questionbank for modeling skills, AI Chat for refining explanations, and grading tools that help you align your writing with what IB criteria actually reward. When exam season arrives, you can tighten the same skills with Predicted Papers and Mock Exams, while the Coursework Library and Tutors keep your IA structure grounded.
Your model doesn’t need to be perfect. Your thinking needs to be visible. And in an IB Math IA, that’s what earns marks.