
An exothermic graph is an energy profile in which the products are lower in potential energy than the reactants. Energy is transferred from the reacting system to the surroundings, so the enthalpy change is negative, . The curve still rises first because reactant particles must overcome an activation-energy barrier.
That short definition contains most of what an IB examiner wants. The difficulty is keeping three ideas separate: the overall enthalpy change, the activation energy, and the temperature change observed in the surroundings. Once those distinctions become automatic, energy-profile questions stop feeling like diagrams to memorize and start behaving like maps you can read.
The current IB Chemistry course, first assessed in 2025, addresses these ideas within Reactivity 1.1, including sketching and interpreting energy profiles for exothermic and endothermic reactions. For wider context, begin with IB Chemistry energetics explained.
Exothermic graph checklist
Before moving into calculations, memorize this compact pattern:
- The vertical axis is potential energy, usually in .
- The horizontal axis is the reaction coordinate or reaction progress.
- Reactants begin at a higher energy level than the products.
- The curve's peak represents the transition state.
- Forward activation energy runs from the reactant level to the peak.
- Enthalpy change runs from the reactant level to the product level.
- is negative because .
- A catalyst reduces activation energy but leaves unchanged.
How to read an exothermic energy profile
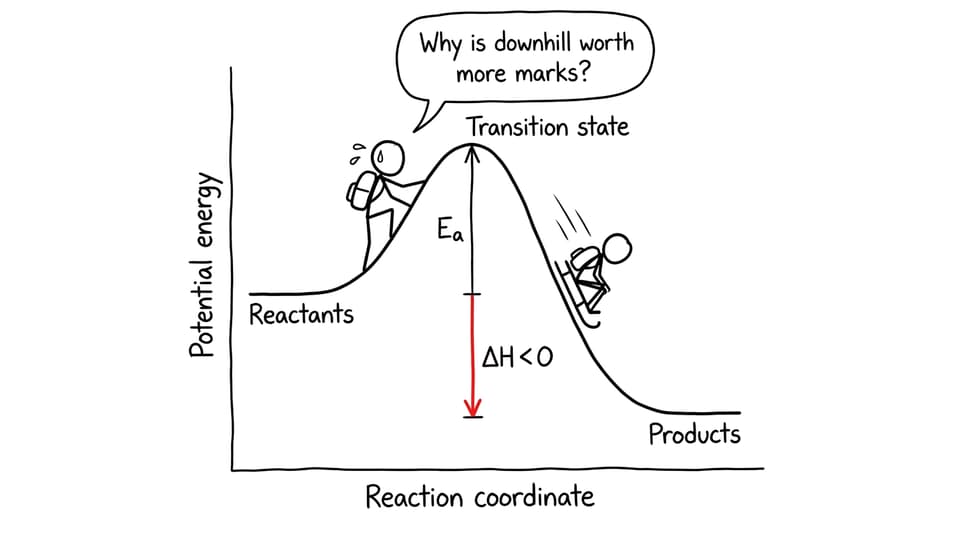
Read the graph from left to right, as you would read a chemical equation. Reactants occupy the initial horizontal level. Products occupy the final level. Between them is a curved pathway rising to a peak before falling.
The upward section matters because an exothermic reaction does not necessarily begin without an energy input. Particles require sufficient energy and a suitable collision geometry to reach the transition state. The minimum energy represented by the rise from the reactants to the peak is the activation energy, .
The downward finish tells you that the products have lower potential energy than the reactants. The difference is transferred to the surroundings, commonly as thermal energy. This produces the defining calculation:
Because the product value is smaller, the answer is negative. RevisionDojo's exothermic reactions guide develops the connection between energy transfer, bond changes, and observations.
What each arrow must show
An activation-energy arrow should begin at the reactant energy level and end at the peak. It should not start at the horizontal axis. A arrow should connect the reactant and product levels vertically, not follow the curved pathway.
That distinction is small on paper but conceptually important. Activation energy concerns the barrier along a pathway. Enthalpy change depends only on the initial and final states.
At Higher Level, profiles may also be used when discussing transition states and multistep pathways. Review the energy profiles and transition states notes if a diagram contains several peaks or intermediates.
Why exothermic reactions release energy
Chemical reactions involve both bond breaking and bond formation. Breaking bonds requires energy; forming bonds releases energy. A reaction is exothermic when forming the product bonds releases more energy than is required to break the relevant reactant bonds.
This is why the products occupy a lower energy level. They represent a more energetically stable arrangement relative to those reactants under the stated conditions. The difference has not vanished. It has moved from the system into the surroundings.
For calculations using average bond enthalpies, apply:
If the formed-bond total is larger, the subtraction produces a negative result. The IB Chemistry bond enthalpy guide provides further worked practice.
How exothermic graphs appear in IB exam questions
A question may ask you to sketch a profile, calculate values from one, compare catalysed and uncatalysed pathways, or connect a temperature rise to a negative molar enthalpy change. The command term determines how much to write.
For draw or sketch, include labelled axes, reactant and product levels, a peak, , and . For determine, show the subtraction and units. For explain, describe the direction of energy transfer and connect it to the relative energy levels.
Worked graph example
Suppose an energy profile provides these values:
- Reactants:
- Peak:
- Products:
First calculate the enthalpy change:
The negative sign confirms that the reaction is exothermic.
Next calculate the forward activation energy:
If the reverse activation energy is requested, measure from the products to the same peak:
A useful check is:
Here, . The negative enthalpy value must remain inside the calculation. Practise identifying these quantities in the energetics and thermochemistry Questionbank.
Worked calorimetry connection
A temperature-time graph is not the same as an energy profile, but an exam may ask you to connect them. Suppose a reaction heats of solution by , using :
The solution, part of the surroundings, gains . Therefore, the reacting system loses that energy. If reacts:
The minus sign comes from the direction of transfer, not from inserting a negative temperature change. Explore related experimental questions in the measuring energy changes Questionbank.
What a catalyst changes on the graph
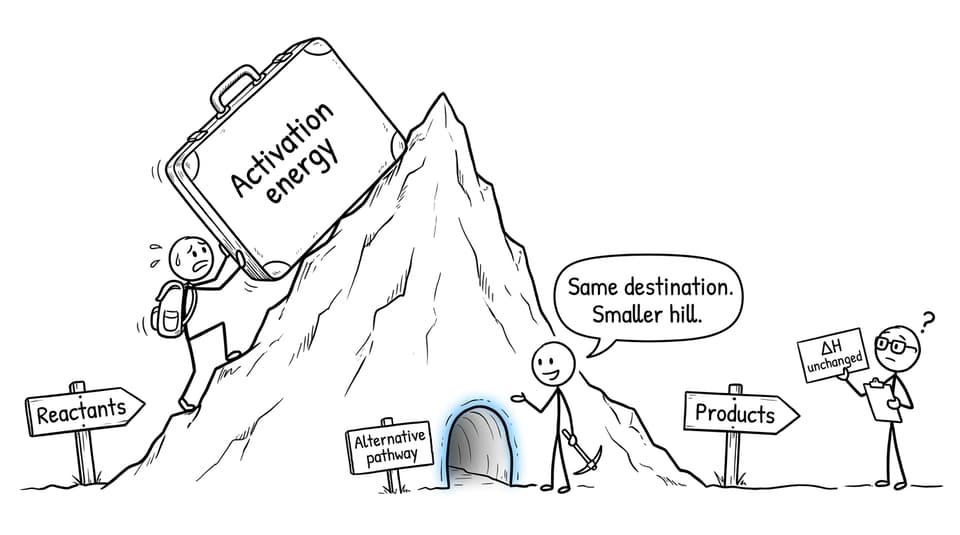
A catalyst provides an alternative reaction pathway with a lower activation energy. On a profile, draw a second curve with a lower peak but exactly the same reactant and product levels.
The catalyst does not alter , because it changes neither the initial nor final state. It also does not turn an endothermic reaction into an exothermic one. Its effect concerns reaction rate, not the overall enthalpy difference.
Common exam mistakes and how to avoid them
Confusing activation energy with enthalpy change
The peak is not . Measure from the reactants to the peak and between the reactant and product levels.
Giving a positive magnitude for an exothermic reaction
If the energy difference is , the enthalpy change is . The sign communicates the direction of energy transfer and is part of the answer.
Defining exothermic only as a temperature rise
A stronger definition states that energy is transferred from the system to the surroundings. A rising surrounding temperature is evidence of that transfer, not the definition itself. See enthalpy change explained for IB Chemistry for the system-surroundings distinction.
Drawing products below the axis
Products need to be below the reactants, not below zero. Energy-profile diagrams display relative energy levels; the horizontal axis is not automatically zero potential energy.
Changing the product level when adding a catalyst
Only the pathway and peak change. Keep both endpoints fixed, which also keeps fixed.
Forgetting labels and units
A scientifically recognizable curve may still be incomplete. Label both axes, the reactants, products, , and . Add when numerical molar energies are given.
Quick-reference comparison
| Feature | Exothermic reaction | Endothermic reaction |
|---|---|---|
| Energy transfer | System to surroundings | Surroundings to system |
| Product energy | Lower than reactants | Higher than reactants |
| Sign of | Negative | Positive |
| Typical surrounding temperature change | Increase | Decrease |
| Activation energy required | Yes | Yes |
| Effect of catalyst on | No change | No change |
Turn recognition into exam marks
Knowing what the curve means is only the first stage. You also need to reproduce it quickly, calculate from it, and explain it in precise language.
Use the RevisionDojo IB Chemistry resource hub to move from Study Notes and short explainer videos into Flashcards and targeted questions. The IB Chemistry Flashcards can reinforce definitions, signs, and arrow positions, while AI Chat and Grading tools can help diagnose an explanation that is chemically correct but too vague.
Once individual topics feel secure, use RevisionDojo's Mock Exams and Chemistry Predicted Papers to practise under time pressure. The Coursework Library and Tutors remain available when the challenge extends beyond a single graph into experimental design or data analysis.
The final habit is simple: read the endpoints before looking at the hill. End lower means exothermic. Then label the barrier, calculate the differences, check the sign, and let the graph tell the chemical story it was designed to show.