
Population distribution describes how people are spread across Earth’s surface at a global, national, or local scale. It identifies spatial patterns, such as clustered, dispersed, linear, dense, or sparse settlement. In IB DP Geography, you must describe these patterns, explain the physical and human factors behind them, and support your analysis with contrasting examples.
A map of population is not simply showing where people are. It is the visible result of thousands of decisions shaped by water, terrain, employment, transport, policy, and history. The exam challenge is to move from seeing the pattern to explaining why it exists.
Population distribution at a glance
For quick revision, remember:
- Distribution means where people live and the spatial pattern they form.
- Density means the number of people per unit area, usually per square kilometre.
- Distribution may be clustered, dispersed, linear, dense, or sparse.
- Physical factors include climate, relief, water, soils, and natural resources.
- Human factors include employment, transport, services, migration, government policy, and historical development.
- Scale matters: a pattern visible globally may hide major regional differences.
The current IB Geography core includes physical and human factors affecting population distribution globally. At the national scale, students also examine economic development, voluntary internal migration, core-periphery patterns, and megacity growth. RevisionDojo’s Changing Population topic hub brings these connected ideas together.
Population distribution is not population density
This distinction is small enough to overlook and important enough to cost marks.
| Concept | What it measures | Typical expression |
|---|---|---|
| Population distribution | The spatial arrangement of people | Clustered, dispersed, linear, dense, or sparse |
| Population density | Population relative to area | People per square kilometre |
| Population size | Total number of people | A numerical total |
Density is calculated as:
Population density = total population ÷ land area
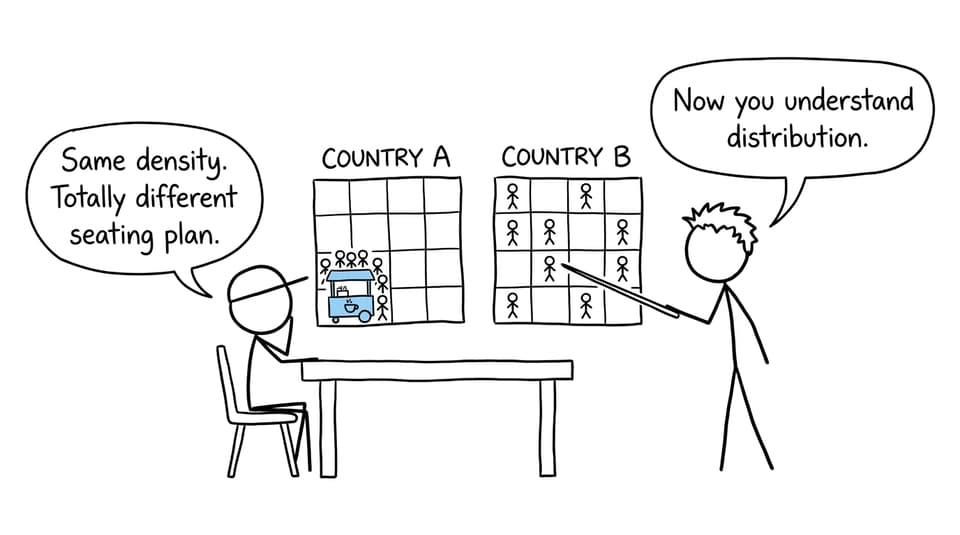
Imagine two hypothetical regions of equal size, each containing 100,000 people. Both have the same arithmetic density. In one, almost everyone lives in a single coastal city; in the other, people are distributed among small inland settlements. Density gives the same answer, but distribution reveals two different geographies.
Use RevisionDojo’s population distribution study notes to practise identifying these differences on maps.
Why is population distributed unevenly?
When answering what is population distribution, definition alone is rarely enough. Strong geographical analysis connects several influences rather than treating each factor as isolated.
Physical factors
Water availability: Rivers, lakes, aquifers, and dependable rainfall support drinking water, farming, industry, and transport. Settlement may therefore form a linear pattern along a river.
Relief and altitude: Flat or gently sloping land is generally easier to build on, farm, and connect with infrastructure. Steep mountains can limit accessibility, although valleys and plateaus may contain important concentrations.
Climate: Extremely cold, hot, or dry environments can constrain agriculture and water supply. Climate does not make settlement impossible, but it may increase costs.
Soils and resources: Fertile land can support intensive agriculture, while minerals or energy resources may attract settlements even where other physical conditions are difficult.
Human factors
Employment and services: Cities attract people through jobs, education, healthcare, markets, and administration. These opportunities can strengthen rural-to-urban migration.
Transport and accessibility: Ports, roads, railways, and navigable rivers connect people to work and trade. New infrastructure can change an existing pattern rather than merely follow it.
Political decisions: Governments influence settlement through planning, housing, regional development, migration controls, and investment.
Historical processes: Earlier trade routes, colonial administration, industrialization, and previous migration can continue shaping present patterns.
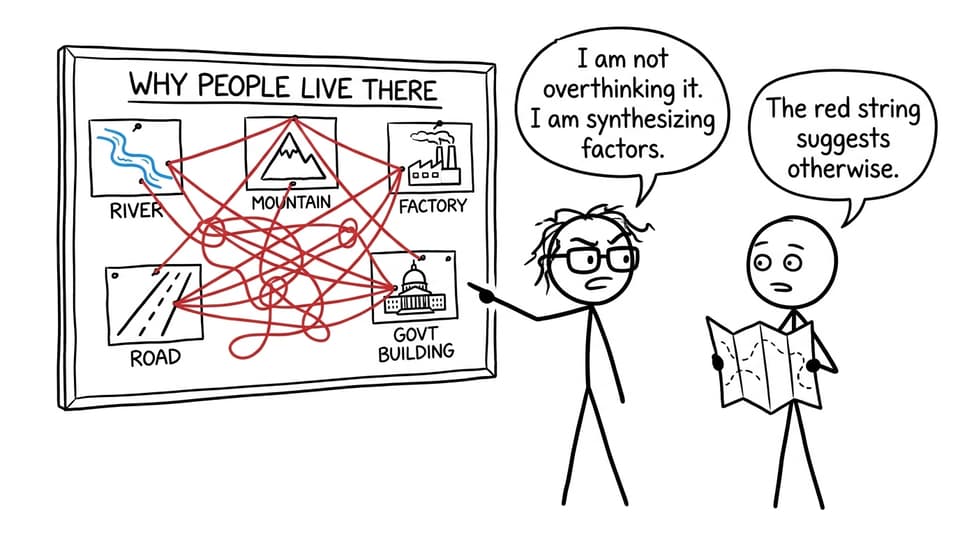
The key is interaction. A fertile plain may encourage farming, but population concentration becomes stronger when roads, markets, and employment also develop there. The RevisionDojo synthesis notes explore how physical and human influences combine.
Examples you can use in IB Geography
China provides a clear national example. Population is heavily concentrated in the east, where major plains, river systems, cities, transport networks, and economic opportunities coincide. Much of the west is more sparsely settled because of factors including high relief, aridity, remoteness, and weaker accessibility. Internal migration and coastal economic growth have reinforced this contrast.
Australia offers a useful comparison. Population is concentrated mainly in coastal urban areas, particularly in the east, southeast, and southwest, while much of the interior is sparsely populated. Water availability, climate, distance, employment, and the historical growth of coastal cities all contribute.
Do not reduce these examples to “good climate versus bad climate.” The IB syllabus encourages analysis of the relative importance of influences. RevisionDojo’s guide to population distribution and economic development helps connect national patterns with core-periphery development.
How population distribution appears in exams
Command terms decide what your answer must do:
- Define: give the precise meaning.
- Describe: identify the spatial pattern using evidence from the stimulus.
- Explain: provide reasons or causes for that pattern.
- Compare: address similarities or differences throughout the response.
- Evaluate: weigh the relative importance or limitations of competing explanations.
Review the IB exam command terms guide before attempting longer responses.
Worked exam-style example
Hypothetical question: Explain two factors responsible for the uneven population distribution shown on the map.
A focused answer could follow this structure:
Population is concentrated along the river corridor. Access to reliable water supports households, irrigation, and industry, making settlement more viable than in the dry interior. A second concentration occurs around the transport junction. Greater accessibility attracts businesses and employment, encouraging migration and reinforcing the urban cluster.
Why does this work? It identifies evidence, names two factors, and develops a causal chain. It does not merely list “water” and “transport.”
For deliberate practice, use RevisionDojo’s Population and Economic Development resources, combining Study Notes and Flashcards with Questionbank feedback. Geography Predicted Papers and Mock Exams can then test whether the same reasoning survives time pressure.
Common exam mistakes
Confusing distribution with density: A map can show concentration without providing enough information to calculate people per square kilometre.
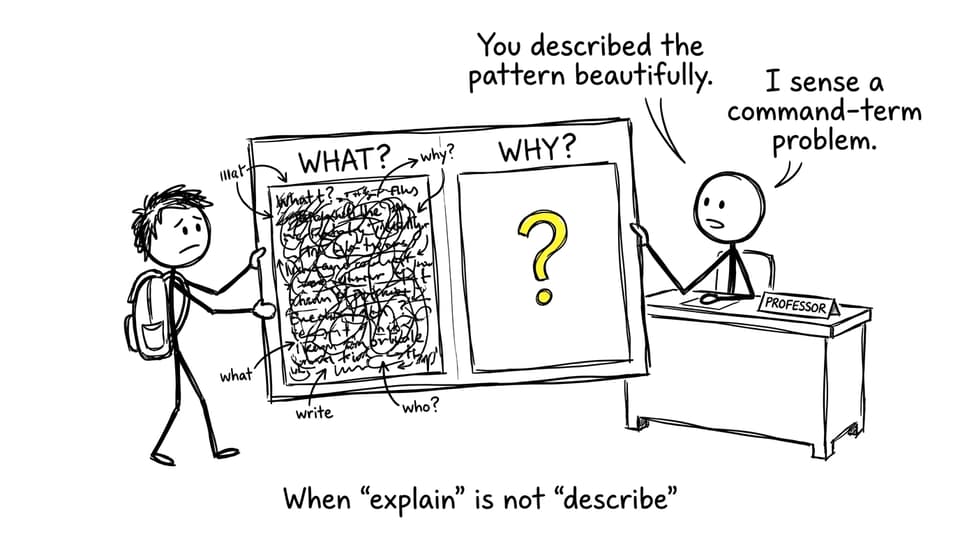
Explaining when asked to describe: Description reports visible locations, concentrations, contrasts, and anomalies. Causes are unnecessary unless requested.
Listing factors without chains: “Water, jobs, and climate” shows recall, not explanation. Show how each factor changes the attractiveness or accessibility of a place.
Ignoring scale: “The north is sparse” means little unless you identify the country, region, or map being discussed.
Using environmental determinism: Harsh conditions constrain settlement but do not control it completely. Technology, wealth, infrastructure, and policy can modify physical limitations.
Forgetting anomalies: If most people cluster near a coast but one inland city is also dense, acknowledge it. Anomalies demonstrate careful stimulus reading.
Quick-reference exam checklist
Before finishing an answer, ask:
- Have I distinguished distribution from density and size?
- Have I stated the scale?
- Have I used directional and locational language?
- Have I cited evidence visible in the stimulus?
- For an explanation, have I connected cause to pattern?
- Have I included both physical and human influences where appropriate?
- For a judgment, have I weighed their relative importance?
A reliable revision loop is simple: learn the definition with Flashcards, build understanding through Study Notes and AI Chat, answer a Questionbank prompt, and use Grading tools to identify the missing link in your reasoning. RevisionDojo also brings together Predicted Papers, Mock Exams, a Coursework Library, and Tutors, making it the ultimate IB resource when one definition needs to become an exam-ready argument.
Turn the map into an explanation
Population distribution is a pattern, but geography begins when you ask what produced it. Learn to see concentrations, corridors, sparse regions, and anomalies. Then connect them to physical opportunities, human decisions, and interactions across different scales.
Start with RevisionDojo’s IB Geography revision notes, then practise explaining one unfamiliar map without looking at your notes. That small step turns recognition into analysis, which is exactly where stronger IB answers begin.