

A price floor is a legally established minimum price below which a good, service, or factor of production cannot be sold. It affects a market only when set above the equilibrium price. A binding price floor raises the market price, reduces quantity demanded, increases quantity supplied, and creates excess supply, or a surplus.
That definition is short enough to memorize. The harder part, and the part that earns marks in IB Economics, is explaining the chain of consequences without confusing a minimum price with a maximum price.
Price floor definition economics checklist
Before attempting an exam-style response, make sure you can:
- Define a price floor as a legal minimum price
- Distinguish binding and non-binding price floors
- Draw and label the market diagram accurately
- Calculate excess supply using Qs minus Qd
- Explain effects on consumers, producers, government, and workers
- Evaluate the policy using elasticity, stakeholder effects, and opportunity cost
- Apply the model to product markets or the labour market
You can place this topic within the wider framework of IB Economics government intervention, where price controls sit alongside taxation, subsidies, regulation, information provision, and direct provision.
How a binding price floor works
Imagine a competitive agricultural market initially at equilibrium. The demand and supply curves intersect at price Pe and quantity Qe. At that point, quantity demanded equals quantity supplied.
The government then establishes a minimum price, Pf, above Pe. Consumers respond to the higher price by demanding less, so quantity demanded falls to Qd. Producers respond by supplying more, so quantity supplied rises to Qs.
The resulting surplus is:
Surplus = Qs - Qd
A price floor below the equilibrium price is non-binding. It does not change the market outcome because sellers are already receiving a higher price. This condition is easy to overlook, but it determines whether the policy has any effect at all.
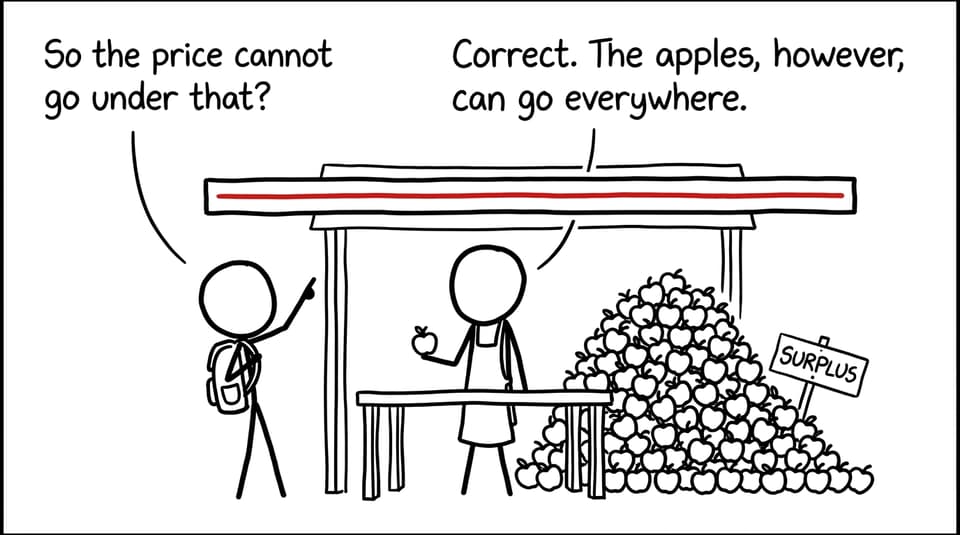
The price floor definition economics students use should therefore contain two ideas: it is a legal minimum, and it becomes binding when established above equilibrium.
How to draw the price floor diagram
A strong diagram should include:
- Price on the vertical axis and quantity on the horizontal axis
- A downward-sloping demand curve labelled D
- An upward-sloping supply curve labelled S
- The original equilibrium, E, at Pe and Qe
- A horizontal minimum-price line at Pf, above Pe
- Qd where Pf meets demand
- Qs where Pf meets supply
- The surplus clearly identified between Qd and Qs
Do not shift demand or supply merely because a price floor is introduced. A price control changes the permitted price; by itself, it does not change the determinants behind either curve. The movements from Qe to Qd and Qs occur along the existing curves.
If diagrams are a weak point, use the RevisionDojo Economics cheatsheets and the focused government intervention video lessons. Watch the explanation once, then reconstruct the diagram from a blank page and explain every label aloud.
Worked price floor example
Suppose a market has the following assumed values:
- Equilibrium price: $10
- Equilibrium quantity: 80 units
- Price floor: $14
- Quantity demanded at $14: 60 units
- Quantity supplied at $14: 100 units
The floor is binding because $14 is above the $10 equilibrium price.
Step 1: Calculate the surplus
Surplus = 100 - 60 = 40 units
Step 2: Identify the privately traded quantity
If the government does not buy the surplus, buyers purchase only 60 units. Although producers want to sell 100 units, consumer demand limits private transactions.
Step 3: Calculate possible government expenditure
If the government guarantees the price by purchasing all 40 surplus units:
Government expenditure = 560**
This purchasing may maintain producer access to the floor price, but it creates an opportunity cost. Storage, distribution, or disposal may also require resources. Avoid claiming that every producer necessarily benefits: producers able to sell more may gain, while those left with unsold output may not.
Why governments impose minimum prices
Governments may use price floors to support incomes in agricultural markets, protect workers through minimum wages, or discourage consumption of certain products by preventing very low prices.
The intended objective matters because it shapes evaluation. A higher agricultural price may raise revenue for producers who sell their output, but consumers face a higher price and purchase less. Government purchasing may strengthen the policy while increasing fiscal costs and encouraging overproduction.
In a labour market, the wage rate appears on the vertical axis and quantity of labour on the horizontal axis. A binding minimum wage can create excess supply of labour in a simplified competitive model: labour supplied exceeds labour demanded. That gap represents unemployment within the model. However, the size of any real-world effect depends on factors including labour-demand elasticity, enforcement, productivity, market structure, and the level at which the wage is set.
For broader context, review RevisionDojo’s notes on reasons for government intervention.
How price floors appear in IB Economics questions
A short explanation should normally follow this sequence:
- Define the price floor precisely.
- State that it is binding above equilibrium.
- Draw and label the diagram.
- Explain why quantity demanded contracts and quantity supplied extends.
- Identify the surplus as Qs minus Qd.
- Connect the model to the question’s context.
For an evaluative response, go further. Consider whether producer income actually rises, how elasticities affect the size of the surplus, who bears the policy’s cost, whether enforcement is practical, and whether an alternative intervention could achieve the objective more efficiently.
A useful judgment is conditional rather than absolute: the policy is more likely to achieve its objective when the floor is carefully set, compliance is strong, and unintended surpluses or employment effects are manageable.
Build this skill with the Topic 2.7 government intervention Questionbank. RevisionDojo’s IB Economics exam tips can also help you match the depth of your answer to the command term.
Common mistakes and misconceptions
Confusing a floor with a ceiling
A floor is the lowest permitted price; a ceiling is the highest. A binding floor sits above equilibrium, while a binding ceiling sits below it.
Calculating the shortage instead of the surplus
At a binding floor, Qs exceeds Qd. Write Qs - Qd, not the reverse.
Shifting the curves
The control creates movements along demand and supply. Only shift a curve if the question gives a separate determinant, such as changing production costs or consumer income.
Assuming all producers gain
The higher unit price may benefit sellers, but fewer units are demanded. Producer revenue and welfare depend on how much is sold, whether the government buys excess output, and producers’ costs.
Drawing without explaining
A diagram is part of the argument, not a decoration. Refer directly to Pf, Pe, Qd, and Qs in your written analysis. The guide to common IB Economics mistakes provides a useful correction process for unexplained diagrams and incomplete causal chains.
Quick-reference summary
| Feature | Exam-ready point |
|---|---|
| Definition | A legal minimum price below which a product, service, or factor cannot be sold |
| Binding condition | The floor is above equilibrium price |
| Consumer response | Quantity demanded decreases |
| Producer response | Quantity supplied increases |
| Market result | Excess supply equal to Qs minus Qd |
| Possible government response | Purchase, store, distribute, or otherwise manage surplus output |
| Main evaluation factors | Elasticity, stakeholder effects, enforcement, fiscal cost, and time period |
| Labour-market application | A binding minimum wage can create excess supply of labour in the competitive model |
Turn the definition into exam performance
Knowing the price floor definition economics requires is only the first step. Marks come from turning that definition into a correct diagram, a visible causal chain, an accurate calculation, and a balanced judgment.
RevisionDojo brings that process together. Start with the IB Economics resource hub, use Study Notes and Flashcards to secure the theory, then move into the Questionbank. AI Chat and Grading tools can help diagnose weak reasoning, while Economics Predicted Papers and Mock Exams build timing and application. The Coursework Library and Tutors provide deeper support when you need to connect economic models with sustained analysis.
The goal is not to remember one horizontal line. It is to see what happens on either side of it, who responds, and why the final judgment depends on context.