
LRAS, or long-run aggregate supply, represents an economy’s potential output when resources are fully employed. In the monetarist/new classical model, it is vertical because the price level cannot change long-run real output. For IB Economics, you must also understand the Keynesian aggregate supply curve, its three sections, and how productive capacity shifts.
The curve looks simple. The thinking behind it is not. A vertical line can test definitions, diagrams, economic growth, inflation, unemployment, supply-side policies, and the assumptions economists make about whether markets adjust by themselves.
LRAS revision checklist
Before attempting an exam question, make sure you can:
- Define long-run aggregate supply precisely
- Draw the monetarist/new classical and Keynesian models
- Distinguish potential output from actual output
- Explain why productive capacity changes
- Separate movements along a curve from shifts of the curve
- Analyse demand changes at different levels of spare capacity
- Evaluate supply-side policies using time lags, costs, equity, and uncertainty
Use the IB Economics 3.2 syllabus notes to see how these ideas connect to aggregate demand, short-run aggregate supply, equilibrium, and output gaps.
What long-run aggregate supply means
Aggregate supply is the real output producers collectively supply at different average price levels. The long run is not a fixed number of months or years. It describes a period in which input prices, including wages, can adjust.
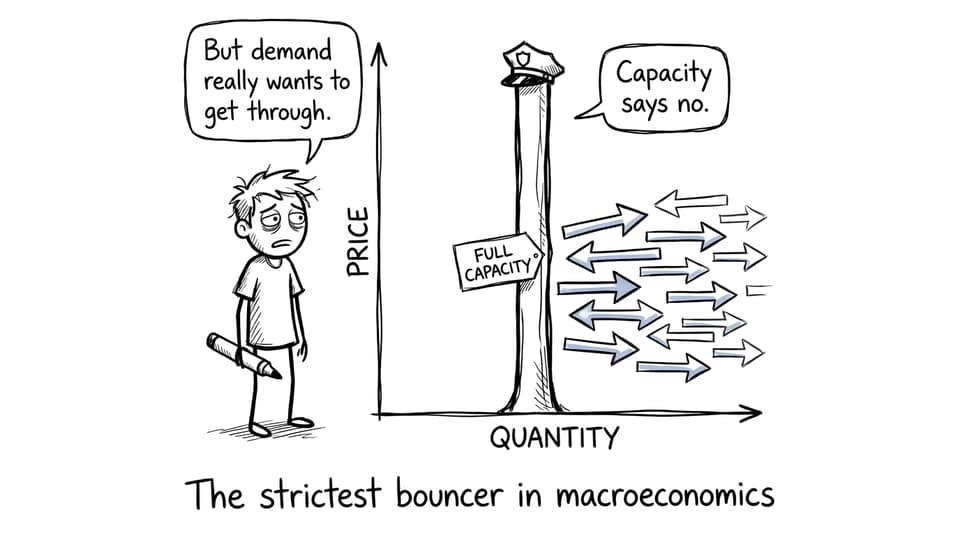
In the monetarist/new classical model, the curve is vertical at potential output, usually labelled Yp or YFE. This output depends on the economy’s productive resources and productivity rather than its average price level. Higher prices alone cannot create additional workers, machinery, natural resources, or technology.
Potential output should not be described as the absolute physical maximum. It is the level of output that can be sustained when resources are fully employed, allowing for the natural rate of unemployment. Explore the surrounding terminology with RevisionDojo’s macroeconomics flashcards.
Classical LRAS versus Keynesian aggregate supply
IB Economics requires alternative views of aggregate supply. Treat them as different models with different assumptions, not as rival diagrams to memorize without explanation.
Monetarist/new classical model
The vertical curve assumes that flexible wages and prices help the economy return toward full-employment output. A rise in aggregate demand may increase real output in the short run, but once input prices adjust, output returns to its potential level while the price level remains higher.
This view therefore places greater confidence in market adjustment and emphasizes policies that improve productive capacity. It is especially useful when analysing long-run growth or the inflationary consequences of persistent demand expansion.
Keynesian model
The Keynesian aggregate supply curve has three sections:
- Horizontal section: Extensive spare capacity allows output to rise with little or no increase in the price level.
- Upward-sloping section: Resources become scarcer, so greater output is accompanied by rising costs and prices.
- Vertical section: The economy has reached full capacity, meaning additional demand raises the price level without increasing real output.
The model implies that the effect of higher aggregate demand depends on where the economy begins. This is powerful evaluation. Fiscal expansion may produce a considerable output gain during a deep recession but mainly inflation when the economy is close to capacity. RevisionDojo’s macroeconomic equilibrium notes show how AD and AS intersections determine real output and the price level.
What shifts productive capacity?
A rightward shift represents an increase in the sustainable productive potential of an economy. A leftward shift represents a decrease. The IB syllabus groups the main determinants around resources, technology, efficiency, and institutions.
| Determinant | Chain of reasoning |
|---|---|
| More or better labour | Education, training, health, or a larger workforce can raise productive capacity |
| More physical capital | Machinery, factories, transport, and digital infrastructure allow more output |
| Better technology | Improved production methods raise output obtainable from existing inputs |
| Greater efficiency | Better allocation or mobility reduces wasted resources and raises productivity |
| Stronger institutions | Effective legal, financial, and regulatory systems can support investment and enterprise |
| Resource loss | Conflict, natural destruction, or lasting capital damage may shift capacity left |
Study these causes in more depth through RevisionDojo’s notes on long-run AS shifts and the guide to long-run supply factors and economic growth.
A crucial distinction is that a change in the price level produces a movement along a given curve. A change in productive potential shifts the entire curve. Meanwhile, a temporary increase in firms’ costs normally affects SRAS rather than long-run capacity. Review that contrast with the short-run aggregate supply notes.
Worked IB Economics exam example
Consider this hypothetical prompt:
Using an AD-AS diagram, explain how government-funded worker training may affect an economy’s potential output.
A strong response could proceed as follows:
- Define the concept. Long-run aggregate supply represents output supplied when resources are fully employed and input prices can adjust.
- Establish the mechanism. Effective training raises workers’ skills and human capital.
- Extend the chain. Higher skills may increase labour productivity, allowing firms to produce more with the available workforce.
- State the diagram change. Productive capacity increases, shifting the vertical curve right from LRAS1 to LRAS2. Potential output rises from Yp1 to Yp2.
- Explain the likely outcome. If aggregate demand is sufficient, the economy can sustain a higher level of real GDP with less inflationary pressure than if capacity had remained unchanged.
- Add evaluation. The effect depends on the training’s quality, participation, relevance to employer needs, implementation cost, and time required for skills to enter production.
Notice what the answer does not claim. Training does not guarantee an immediate rise in actual output. It first changes productive potential; actual output also depends on aggregate demand and how effectively the policy is delivered.
Practise converting chains like this into timed responses with the IB Economics Questionbank.

How LRAS appears in IB exam questions
The official IB course places alternative aggregate supply views, long-term shifts, and macroeconomic equilibrium within Unit 3.2. Questions can therefore test the concept directly or embed it within economic growth and supply-side policy.
For explanation questions, use a complete causal chain rather than listing determinants. For evaluative questions, compare models and consider policy-specific conditions. For data-response tasks, refer directly to the supplied economy, policy, and evidence. HL policy responses should connect calculations or data to a justified recommendation rather than treating the diagram as the conclusion.
RevisionDojo’s comparison of IB Economics Paper 1 and Paper 2 explains how independent argument differs from stimulus-based application. Its broader IB Economics exam tips can help with command terms, timing, and correction routines.
Common mistakes to avoid
- Labelling the axes as price and quantity: Use price level vertically and real GDP horizontally.
- Drawing a vertical SRAS curve: In the standard monetarist/new classical diagram, SRAS slopes upward while long-run supply is vertical.
- Confusing actual and potential output: An economy can operate below or temporarily above potential output.
- Shifting the curve because AD rises: Demand does not automatically change productive capacity.
- Listing policies without mechanisms: Explain how a policy changes the quantity, quality, or productivity of factors of production.
- Assuming every supply-side policy works: Evaluate costs, time lags, implementation, unintended effects, and relevance to the economy.
- Mixing the models silently: Name the monetarist/new classical or Keynesian framework being used.
Final exam-ready summary
The memorable idea is simple: demand determines how much productive capacity is being used, while long-run supply describes how much sustainable capacity exists. The monetarist/new classical diagram represents that capacity with a vertical line. The Keynesian model shows why demand can have different effects when spare capacity varies.
RevisionDojo is the ultimate IB resource for turning that distinction into marks. Combine concise Study Notes and Flashcards with targeted Questionbank practice, then use AI Chat and Grading tools to diagnose weak reasoning. Predicted Papers, Mock Exams, the Coursework Library, and expert Tutors can take you from recognizing the diagram to explaining, applying, and evaluating it under exam conditions.