
Your IA isn't marked by the kilogram.
But a lot of students write it like it is.
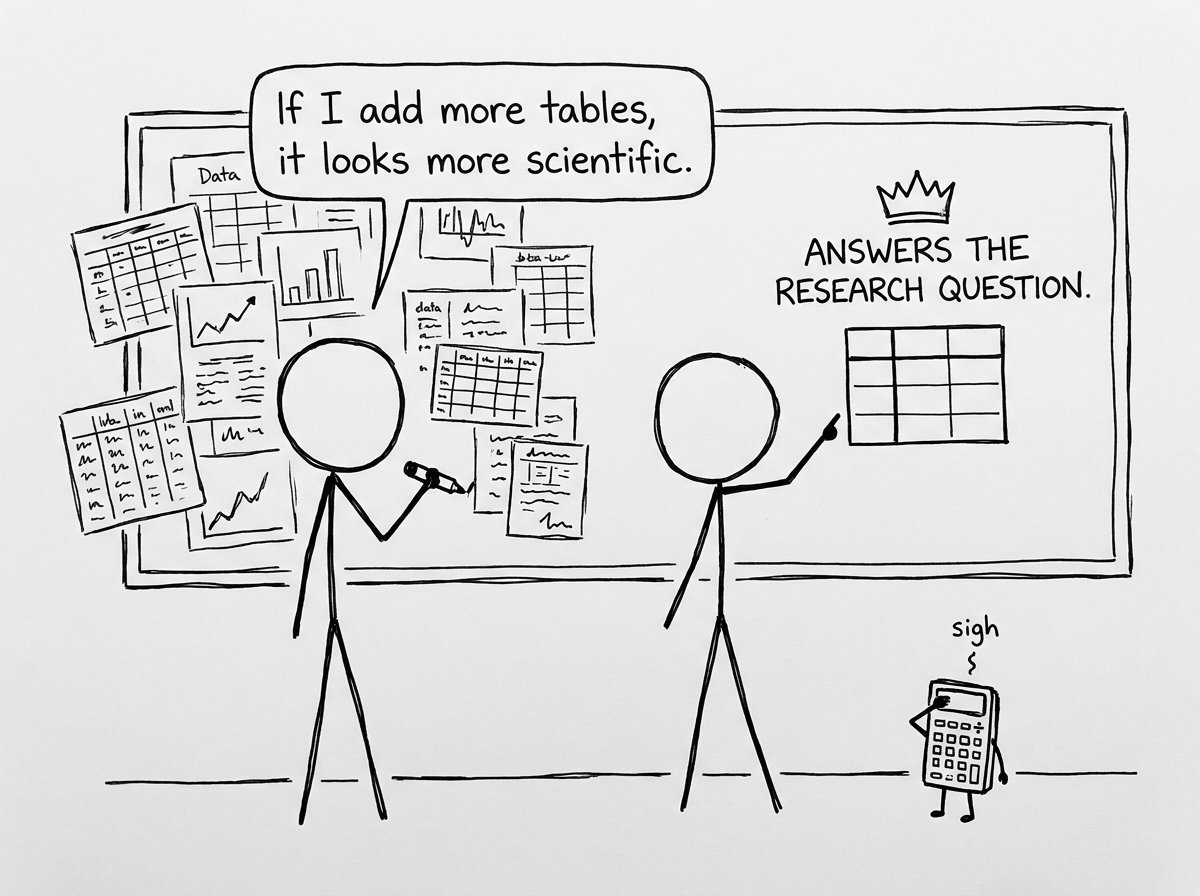
Somewhere around 1:20 a.m., the document starts to look scientific: Table 1, Table 2, Table 3… and suddenly you're at Table 17 and you can't remember what the research question was anymore. If you've been wondering how many tables your IA should include, you're not really asking about tables. You're asking how to look credible without drowning your examiner.
This post will give you an examiner-ready way to decide the right number of tables for an IA, so your work feels clean, intentional, and easy to award marks to.

The short answer: there's no magic number of IA tables
The IB does not publish a rule like "your IA needs 6 tables." In most subjects, what matters is whether your IA communicates evidence clearly and supports your analysis.
A good rule of thumb is this:
- Most strong IAs use 3--8 tables in the main body.
- Some investigations need fewer (especially essay-style IAs).
- Some need more (especially data-heavy experimental IAs), but only if each table has a job.
The scoring logic is simple: examiners reward clarity, relevance, and interpretation. Extra tables only help if they reduce confusion.
If you want a practical starting point for visuals, read Tips for Organizing Graphs and Tables in Your IA and then come back to the decision framework below.
A quick checklist for deciding how many tables your IA needs
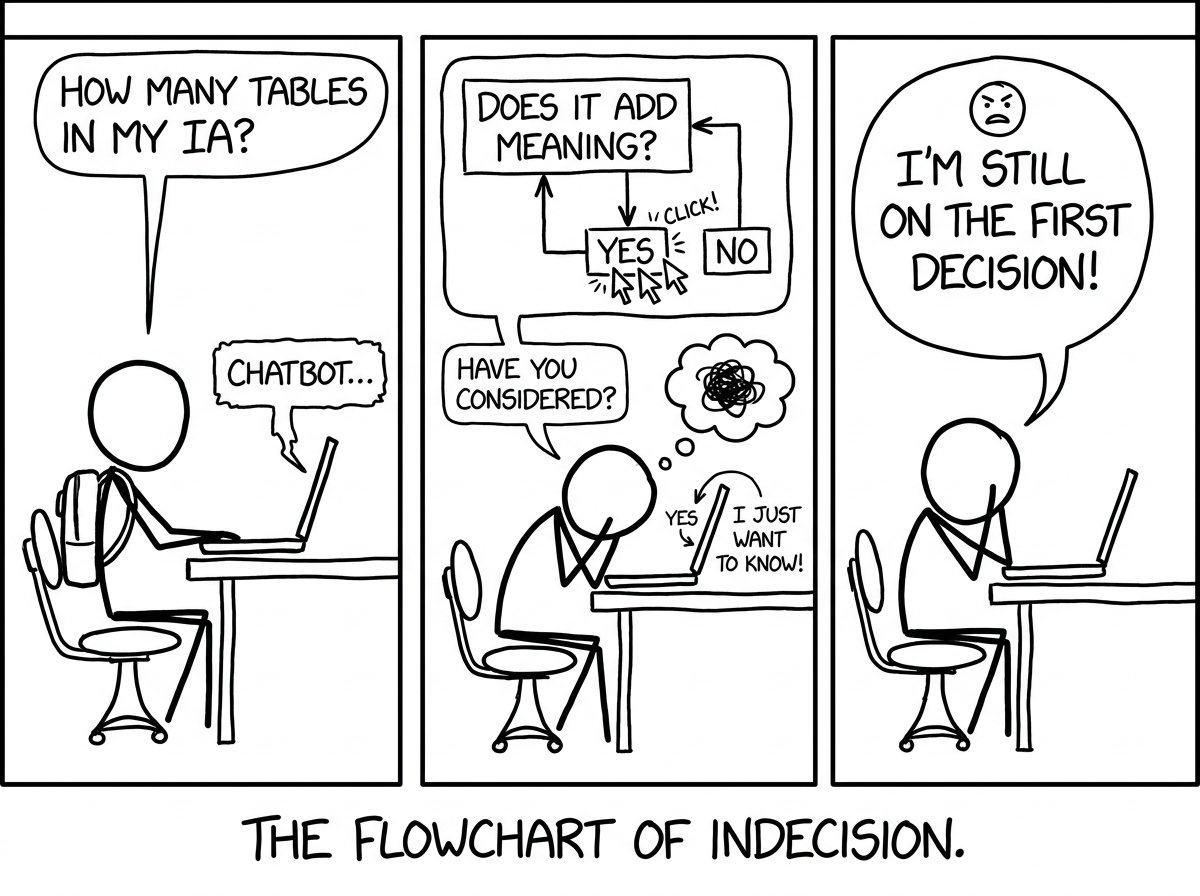
Before you add another table to your IA, ask these five questions:
- Does the table help answer the research question or aim of the IA?
- Will the reader understand the trend faster with a table than with text?
- Is this table referenced and explained in the main body of the IA?
- Is it the cleanest version of the data (not duplicated elsewhere)?
- Could this be moved to the appendix without weakening the argument?
If you answered "no" to any of these, your IA probably doesn't need that table.
For subject-specific expectations (especially for sciences), start with IB Internal Assessment Guides and confirm what the criteria emphasize.
Why tables matter in an IA (and why too many can hurt)
Tables are persuasive because they look like evidence. In an IA, they also create a quiet promise: "I measured something carefully, and I can prove it."
The problem is that examiners don't award marks for effort. They award marks for what they can clearly see you did, why you did it, and what you concluded.
Too many tables in an IA usually creates three hidden problems:
- Signal gets buried in noise. The examiner can't find what matters.
- Your analysis looks thinner. Pages fill up with formatting instead of reasoning.
- You repeat yourself. The same values appear in multiple places, which feels messy and unsure.
If you've ever looked at a top-scoring sample and noticed how calm it feels, it's because it's selective. It uses tables like stepping stones, not like a swamp.
For a strong data mindset, use 10 Best Practices to Write Up Data and Results in Your IB IA as your reference point.
How many tables should an IA include? Use this 3-part framework
Instead of chasing a number, build your IA tables around three roles. Most high-quality IAs have a table for each role.
Data capture tables (what you measured)
These tables record raw or primary data (or a representative sample of it).
In many experimental sciences, tables should include units, uncertainties, and consistent decimal places. RevisionDojo's science-specific guidance makes this explicit, for example:
Typical count in the IA main body: 1--2 tables.
If you have repeated trials or large datasets, keep the clean, readable version in the IA and push the full spreadsheet-style dump to the appendix.
Processing tables (what you calculated)
These tables show derived values: averages, uncertainties, transformations, percentages, gradients, indexes, or whatever your method requires.
This is where a table can actually earn you marks because it reveals your thinking. The best processing tables in an IA:
- show one clear calculation path
- avoid redundant columns
- make it easy to check your logic
Typical count: 1--3 tables.
If your processing takes many steps, consider compressing it into one table plus one worked example in text.
Summary tables (what the evidence says)
This is the table that helps the examiner decide you did real analysis.
A good summary table might include:
- key patterns or trends
- comparison of conditions
- final model parameters
- evaluation metrics
Typical count: 1--2 tables.
If your IA has a lot of graphs, you may only need one summary table to pull everything together.
Main body vs appendix: where should IA tables go?
A clean principle for any IA:
- If the examiner needs it to understand your argument, it belongs in the main body.
- If it's supporting detail, it belongs in the appendix.
Students often treat the appendix like a storage unit. But your appendix should feel like receipts: useful if someone checks, unnecessary to read to understand the story.
A useful way to audit this is to read your IA and temporarily hide your appendix. If your analysis still makes sense, your appendix is doing its job.
If you're unsure whether your document looks professional and readable, scan Common Formatting Errors That Lower IA Marks. Formatting issues often show up first in tables.
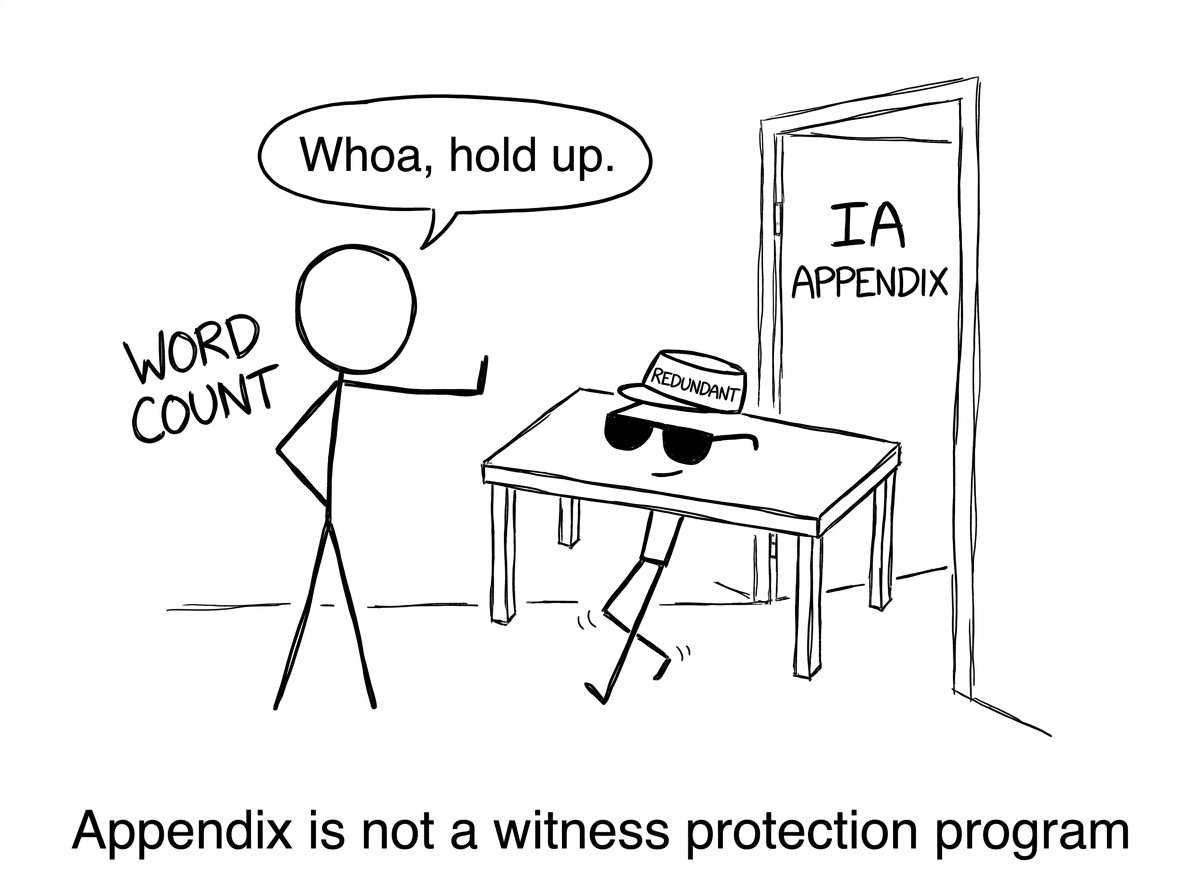
Table quality beats table quantity: what examiners actually want
When students ask how many tables an IA should include, what they really fear is that fewer tables will look "less academic."
But examiners don't reward academic-looking. They reward academic-thinking.
Here's what "academic-thinking" looks like in tables inside an IA:
- Every table has a specific title that tells the reader what it contains.
- Columns include units (and uncertainties where relevant).
- Numbers have consistent precision tied to the instrument or source.
- Tables are referenced in the text (e.g., "As shown in Table 2…"), and you interpret what matters.
- No duplicates. If the values appear in a graph, the table should add something extra (like uncertainty, sample size, or processed values).
If you're writing a Math IA, professional structure and presentation can make a big difference to how easy it is to award marks. See How to Present a Professional Math IA with Confidence for a formatting mindset that applies to tables too.
A realistic table plan for common IA types
Not every IA behaves the same. Here are sensible table ranges that keep most IAs clear.
Experimental science IA (Chem, Bio, Phys, ESS)
A strong experimental IA commonly uses:
- 1 table for key raw data (or a representative sample)
- 1--2 tables for processing and uncertainty handling
- 1 summary table (optional) for final results or model parameters
Typical total in main body: 4--7 tables.
Essay-style or sources-based IA (some humanities)
These IAs often use fewer tables, and sometimes none. If you include tables, they usually summarize:
- coded qualitative themes
- frequency counts
- comparative evidence snapshots
Typical total: 0--3 tables.
Math IA / modeling-heavy IA
Tables are helpful when they show parameter values, iterations, error measures, or comparisons between models.
Typical total: 2--6 tables.
If you're building your Math IA right now, A Step-by-Step Guide to IB Math AI Internal Assessment pairs well with a careful table plan.
How RevisionDojo helps you choose the right number of IA tables
The fastest way to fix table overload is to stop guessing what "good" looks like.
On RevisionDojo, you can:
- compare your IA layout to high-quality samples in IA/EE/TOK exemplars (examiner-verified)
- check subject expectations through the IB Internal Assessment Guides
- use Flashcards for Internal Assessment (IA) to drill what criteria language actually means
- practice data interpretation with RevisionDojo's Questionbank and targeted Study Notes
- tighten your explanations using AI Chat (especially for captions and interpretation paragraphs)
- test your readiness with Predicted Papers and Mock Exams so your IA skills transfer to exam performance
- improve clarity with Grading tools like the rubric-aligned graders (where available) and then iterate
- find inspiration (without copying) from the Coursework Library
- book support from Tutors if your analysis is strong but your presentation is chaotic
A calm IA isn't just nicer to read. It's easier to mark.
FAQ: How many tables should an IA include?
Is there a minimum number of tables required in an IA?
There is no universal minimum number of tables required in an IA, because IB subjects vary widely in what "evidence" looks like. In some IAs, tables are essential because you collect quantitative data and must present it clearly. In other IAs, your evidence is mainly textual, and tables are optional. The real requirement is that your IA communicates your method, data, and reasoning in a way an examiner can follow. If a table would make your reasoning clearer, include it. If it would only take up space, it's not helping your IA score.
Can too many tables lower my IA marks?
Too many tables can indirectly lower IA marks because they reduce clarity and make it harder for the examiner to locate the key evidence. An IA with table overload often pushes analysis into the background, which is where marks usually live. Extra tables also increase the chances of formatting errors like missing units, inconsistent decimal places, or unlabeled uncertainty. When examiners see messy presentation, they may doubt the care in your method as well. The goal isn't to look "data-heavy," it's to look "decision-ready," meaning the examiner can see what you did and why it matters. Fewer, cleaner tables usually make your IA feel more controlled.
Should I put raw data tables in the appendix or the main body of the IA?
In most cases, a representative portion of raw data belongs in the main body of the IA, while very large raw datasets belong in the appendix. The main body should contain what the examiner needs to understand how you collected data and what you did with it. If you include every repeated trial and every sensor reading in the main body, your IA becomes harder to navigate. A smart compromise is to show one clean raw data table in the IA, then place the full dataset in the appendix and reference it clearly. This keeps your IA readable while still being transparent. The key is that your processed data and analysis must remain in the main body, because that's where your argument happens.
Do tables count toward the IA word count?
In many IB components, tables are not counted the same way as body text, but rules differ by subject and syllabus version. Even when tables don't count toward word count, they still count toward the reader's attention and your page real estate. If your IA is crammed with tables, it can still feel excessive even if you technically stay within word limits. Examiners also have practical reading limits, and a bloated IA can cause them to miss your strongest reasoning. Treat tables as part of your communication strategy, not a loophole. When in doubt, prioritize clarity and interpret your tables in the text.
The takeaway: how many tables should your IA include?
Your IA should include as many tables as necessary to make your evidence obvious -- and as few as possible to keep your thinking visible.
If you want a final, practical target: most IB students do best when their IA has around 3--8 tables in the main body, with extra raw data moved to the appendix. But the real win is not hitting a number. It's making every table earn its place.
When you're ready to sanity-check your layout, use RevisionDojo to compare against exemplars, tighten your presentation, and get feedback faster: the Coursework Library, Study Notes, Flashcards, AI Chat, and Grading tools are built for exactly this moment in the IA journey.
If your tables make your argument clearer, your examiner relaxes. And when your examiner relaxes, marks tend to follow.
