


If you’ve ever stared at your IA draft and thought, “My data is good… so why does it look wrong?”, you’re not alone.
Most IB students don’t lose marks because their experiment, model, or investigation is weak. They lose marks because the evidence feels messy. A graph with missing units. A table that repeats the same numbers three times. A figure that appears with no explanation, like it wandered into the IA by accident.
In an IA, graphs and tables aren’t decoration. They’re your proof. When they’re organized, the examiner glides through your logic. When they’re not, even strong analysis starts to look uncertain.
For inspiration, it helps to see what “clean” looks like in real student work. Start with RevisionDojo’s IB Coursework Exemplars, then come back and apply the principles below.
IA graphs and tables: a fast organization checklist
Use this before you export your final PDF:
-
Every graph/table has a number + title that describes the relationship (not “Graph 1”).
-
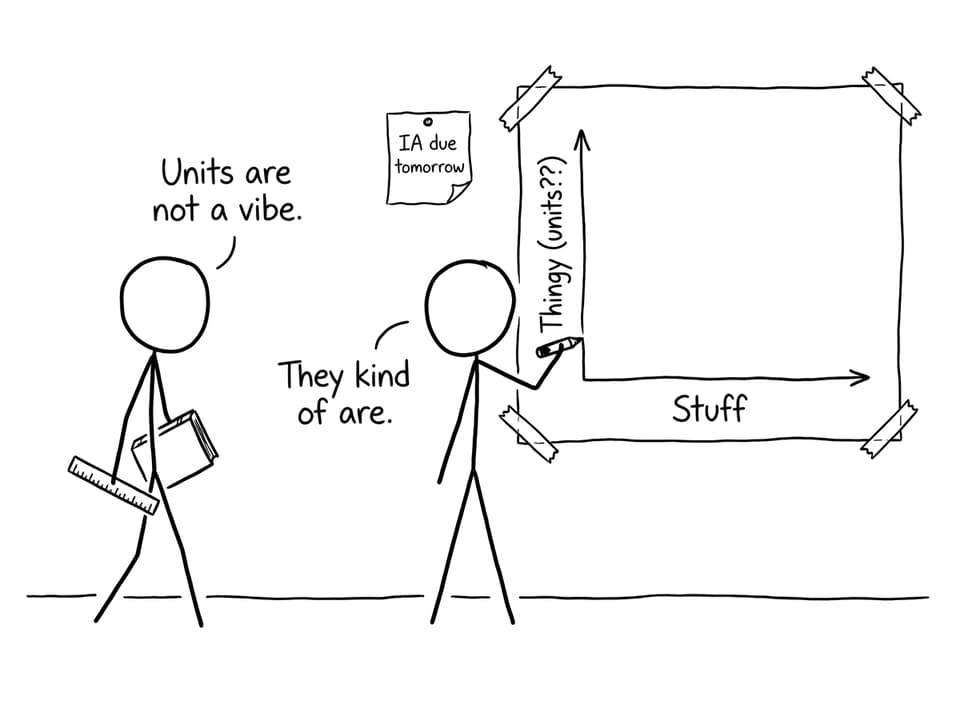
Every axis/column header has variable name + unit.
-
Formatting is consistent (fonts, decimals, significant figures, style).
-
Each figure is introduced, referenced, and interpreted in the text.
-
Raw data is separated from processed results (often via appendix).
-
Visuals are used to answer the research question, not to “show work.”
If you want a broader write-up workflow, pair this article with 10 Best Practices to Write Up Data and Results in Your IB IA.
Why organization matters in an IA (more than you think)
Examiners read fast. Not because they’re careless, but because they’re trained to look for evidence that matches criteria. A well-organized IA helps them find what they need quickly: patterns, comparisons, uncertainty, and what your results mean.
Disorganized visuals create two quiet problems:
-
They hide the point of your IA. The reader spends energy decoding your presentation instead of rewarding your thinking.
-
They weaken your analysis. Even if you interpret well, unclear graphs and tables make your interpretation feel less trustworthy.
If you’re building toward a top score, it’s worth seeing how high-scoring students structure their visuals across subjects. Browse one or two subject-specific sets like IB Biology IA Examples or IB Geography IA Exemplars and pay attention to how they title, label, and reference every figure.
Choose the right visual for the job (not the prettiest one)
A simple rule: the best graph is the one that makes the trend unavoidable.
When graphs help your IA more than tables
Use a graph when you want the examiner to see:
-
change over time (often a line graph)
-
relationships/correlation (often a scatter plot)
-
comparisons across categories (often a bar chart)
If you’re writing a Math exploration, the expectations for visuals can be surprisingly strict: they’re part of mathematical communication. This is explained well in How to Use Visuals Effectively in Your IB Math IA.
When tables help your IA more than graphs
Use a table when you need to show:
-
exact values the reader might check
-
steps in data processing (so your method can be followed)
-
summary statistics (mean, SD, parameter values)
If you’re unsure how many tables is “too many,” you’ll like How Many Tables Should an IA Include?. It’s reassuring because it replaces guesswork with purpose.
Label like you’re writing for a stranger (because you are)
The examiner hasn’t been living inside your IA for two months. They should never have to infer what an axis means or what a column represents.
Every graph in your IA should include:
-
a descriptive title (what relationship is being shown)
-
axes labeled with units
-
a legend (only when needed)
-
readable scale choices (not overly compressed)
Every table in your IA should include:
-
a descriptive title
-
consistent decimal places/significant figures
-
units in the header (not sprinkled in cells)
-
uncertainty where relevant (especially in experimental sciences)
A dedicated walkthrough is here: How to Format and Label Graphs in Your IA.
Keep visuals simple: one figure, one message
A common IA trap is trying to “prove effort” by stacking information into one monster visual.
Instead, aim for one core takeaway per graph or table:
-
One graph shows the main trend.
-
One table shows the essential processed values.
-
If needed, a second graph explores anomalies or a secondary relationship.
Practical ways to declutter:
-
remove gridlines unless they add meaning
-
avoid 3D effects
-
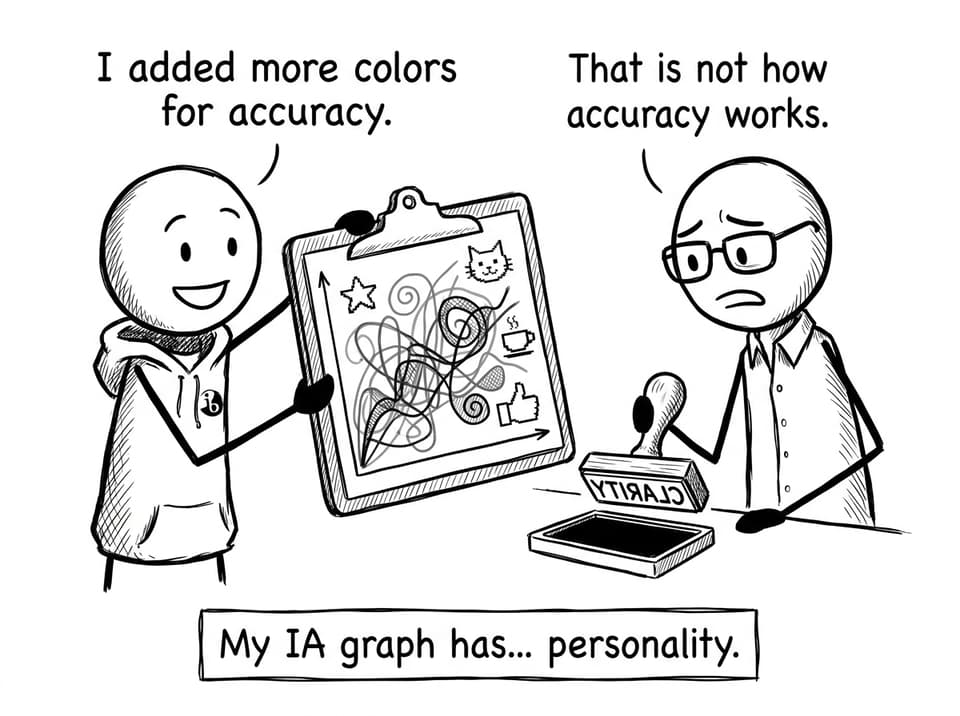
limit colors to what improves readability
-
split complex visuals into two smaller ones
When in doubt, ask: “If I removed this element, would the trend become clearer?” In an IA, clarity beats decoration.
Integrate every graph and table into your IA narrative
Your visuals should never “sit there.” They should do work inside your argument.
A strong IA pattern looks like this:
-
Introduce the figure (“To test whether X changes with Y…”)
-
Point to what matters (“Figure 2 shows a positive relationship…”)
-
Interpret with reasoning (“This suggests… because…”)
-
Evaluate briefly (“However, uncertainty increases at…”)
Try replacing “See Table 1” with a sentence that states a conclusion the examiner can reward.
If you want to sharpen this across the whole paper (not just visuals), What IB Examiners Look for in a Strong IA helps you write with criteria in mind.
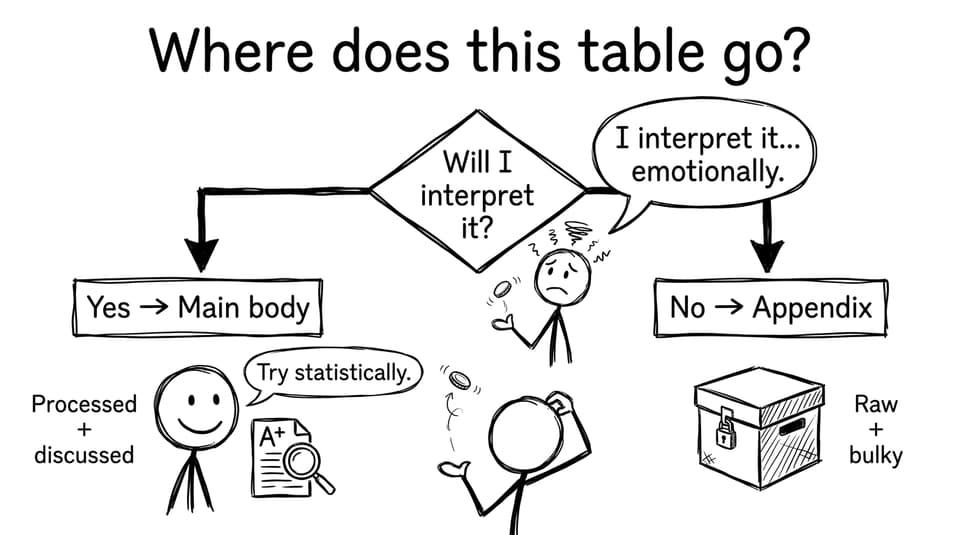
Put raw data in the right place (and stop duplicating)
A clean IA separates:
-
Raw data (often bulky, best kept out of the main flow)
-
Processed data (what you actually use to argue)
-
Final results (the values that answer the research question)
If your appendix is allowed in your subject, it’s a great home for the long raw-data table. Then your main body can show a smaller processed table and the key graph.
The biggest mistake here is duplication: students show the same numbers in a raw table, then again in a processed table, then again in a graph, without adding insight each time. Keep the version that adds meaning.
Tools and workflows that make IA visuals easier
When your deadline is close, organization needs systems.
RevisionDojo is built for that moment: when you want your IA to feel examiner-ready.
-
Use the Coursework Library to compare how strong students format tables and figures: IB Coursework Exemplars.
-
Use AI Chat to sanity-check whether each graph actually supports your research question.
-
Use Study Notes when you’re unsure which statistical test or uncertainty method fits your data.
-
Use Grading tools to spot where your communication is unclear (often the real reason visuals lose impact).
-
Use the Questionbank, Flashcards, Mock Exams, and Predicted Papers to keep exam prep moving while the IA is being finalized.
-
If you’re stuck, Tutors can help you rebuild a results section so your visuals and analysis finally match.
Closing: make your IA easy to reward
A strong IA doesn’t just contain good data. It makes good data obvious.
When your graphs and tables are organized, labeled, and woven into your narrative, you stop asking the examiner to work hard. You guide them straight to the marks: clear evidence, clear interpretation, clear evaluation.
If you want models you can trust, browse RevisionDojo’s IB Coursework Exemplars and compare how top students present visuals. Then use RevisionDojo’s tools -- from AI Chat to Grading tools to Study Notes -- to turn your own IA visuals into something calm, consistent, and examiner-friendly.
