


Data can make an IA feel like a real investigation, not a homework assignment dressed up in headings. But in an IB Math IA, data can also quietly ruin your score when it becomes a pile of numbers with no purpose.
The best IAs don’t have the most data. They have the most defensible data. Data that clearly answers a question, supports a model, and leaves an examiner thinking, “I trust this student’s decisions.” That’s the standard you’re aiming for in IB coursework: credibility first, complexity second.
A quick IB data checklist (save this before you start)
Use this as your quick filter before you commit to a dataset in your IB Math IA:
-
Can you state what the data will prove in one sentence?
-
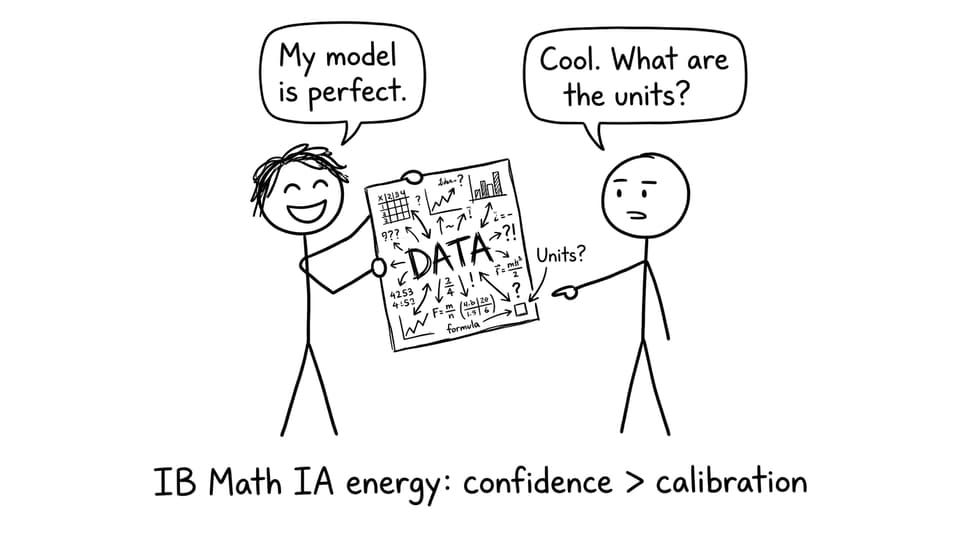
Are the variables clearly defined (and measurable) with units?
-
Do you know whether your data is primary, secondary, or simulated?
-
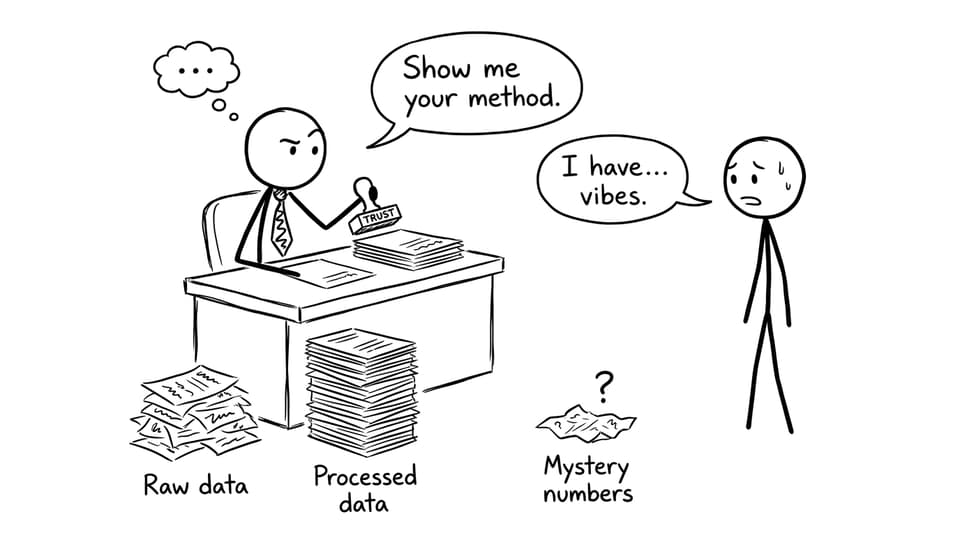
Is your raw data separated from processed data?
-
Can you visualize the pattern quickly (scatter, histogram, time series)?
-
Have you planned at least one reliability check (outliers, residuals, uncertainty, bias)?
If you need a structure reference before you touch spreadsheets, use How to Structure Your IB Math IA Logically alongside your planning.
Start with purpose, not a spreadsheet
A common IB trap is starting with whatever data is easiest to find, then trying to force mathematics onto it. Examiners can feel that.
Instead, start with a single purpose statement:
“This dataset will help me estimate parameters and test whether my chosen model fits reality.”
When your purpose is clear, your data choices become obvious: what you measure, how often, over what range, and what math you can justify.
If you’re still choosing an IA direction, browse The Best IB Math IA Topics for 2025 to find ideas that naturally produce meaningful data.
Collect reliable data (and say how you did it)
For an IB Math IA, data is not just a resource. It’s evidence. Evidence needs a paper trail.
You usually have three options:
Primary data
You measure it yourself (experiments, timing, surveys, video analysis). This often boosts personal engagement in IB writing because your choices are visible.
Secondary data
You use a credible dataset (official databases, published studies). Strong secondary-data IAs explain why primary data wasn’t realistic and how the source is reliable.
Simulated data
You generate data from assumptions. This can be valid in IB, but only if you clearly define the rules, justify assumptions, and explain what the simulation represents.
For practical steps that keep your process defensible, follow How to Collect and Organize Data for the IB Math IA and cross-check common pitfalls in Top Mistakes to Avoid in IB Math IA Data Collection.
Organize the data so an examiner can trust you
Your examiner should never have to guess what a column means.
In an IB Math IA, clean presentation is part of mathematical communication. That means:
-
Tables with headings and units
-
Clear variable names (avoid “X1” unless you define it)
-
Raw data shown separately from cleaned or transformed data
-
A brief note explaining what you changed and why
This is where RevisionDojo helps in a very practical way: students tend to write better when the workflow is clear. Using RevisionDojo’s Study Notes and Flashcards for statistics, modeling, and interpretation keeps your explanations tight, not rambling. When you’re preparing for exams alongside your IA, the same system scales: Notes for learning, Flashcards for recall, and Questionbank for practice.
Clean your data, but don’t erase the story
Cleaning data is not the same as making it “look nice.” It’s about removing errors while protecting meaning.
Ask:
-
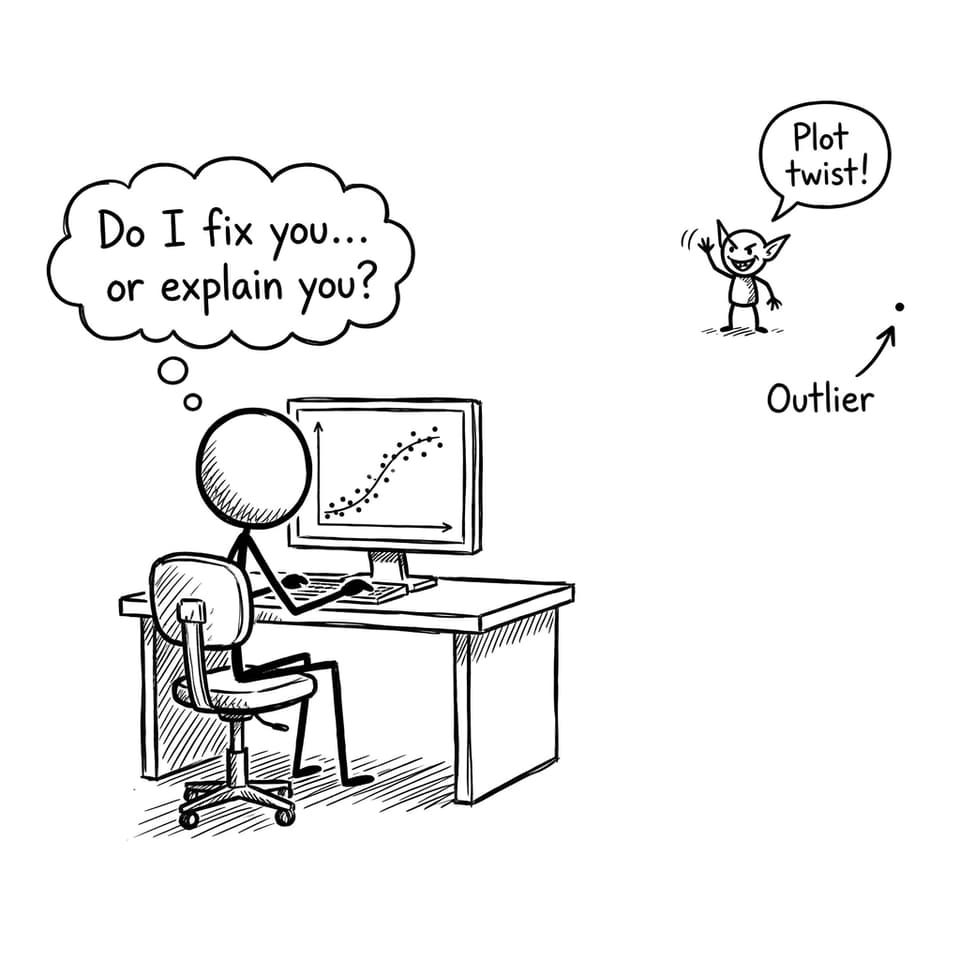
Is an outlier a measurement mistake or a real event?
-
Are there inconsistent units or rounding issues?
-
Did your method change halfway through collection?
If you remove points, say so and justify it. If you keep weird points, explain them. In IB, honesty is not a weakness. It’s often the difference between “calculation” and “reflection.”
Visualize early: graphs are your hypothesis generator
Many students treat graphs like decoration added at the end. In an IB Math IA, graphs are how you discover what math is appropriate.
Match the visual to the question:
-
Scatter plot: relationship/correlation
-
Line graph: change over time
-
Histogram/box plot: distribution and spread
Then do the underrated step: label properly. Axis titles, units, and a short caption telling the reader what they should notice.
Need a stronger modeling bridge between your plots and your math? Use How to Develop Mathematical Models from Real Data in the IB Math IA and keep it aligned with How to Integrate Real Data Effectively in the IB Math IA.
Do the math: analysis is more than pressing “regression”
Technology is allowed in IB Math IAs, but examiners reward students who explain what the technology did.
If you run a regression or fit a function:
-
State the model form and why it matches the graph’s behavior
-
Report key parameters and define what they mean in context
-
Use at least one check: residuals, R² (with interpretation), or comparison against expected theory
-
Explain limitations: range, assumptions, measurement uncertainty
RevisionDojo’s AI Chat is useful here because it can act like a skeptical reader. Ask it: “What assumptions am I making with this model?” or “What would an examiner question in this interpretation?” Then refine.
Reflect like an investigator (this is where IB marks live)
Reflection is the section students rush, yet it’s where strong IB work separates itself.
Good reflection answers:
-
How reliable is the data and why?
-
Which sources of error matter most?
-
What would you change if you repeated the study?
-
How does the limitation affect your conclusion?
If you want a reality check on what top work looks like, read Using IA/EE Exemplars to Improve Your IB Math IA. You can also browse coursework samples in the IB Math AA coursework exemplars library to see how high-scoring students talk about uncertainty without sounding vague.
Conclusion: make your data earn its place
In an IB Math IA, effective data use is a quiet form of persuasion. You’re persuading the examiner that your mathematics belongs here, that your decisions are intentional, and that your conclusion is earned.
If you want a workflow that supports both your IA and exam prep, RevisionDojo is built for exactly that: Questionbank practice to keep skills sharp, Study Notes and Flashcards to tighten understanding, AI Chat to refine explanations, Grading tools to pressure-test drafts, Predicted Papers and Mock Exams to stay exam-ready, a Coursework Library to model top work, and Tutors when you want human feedback.
Your next step: choose one dataset in your draft and ask, “What job is this data doing?” If the answer isn’t clear, fix that first. Everything else gets easier after that.