


The first time you use real numbers in an IB Math IA, it feels like stepping outside the textbook.
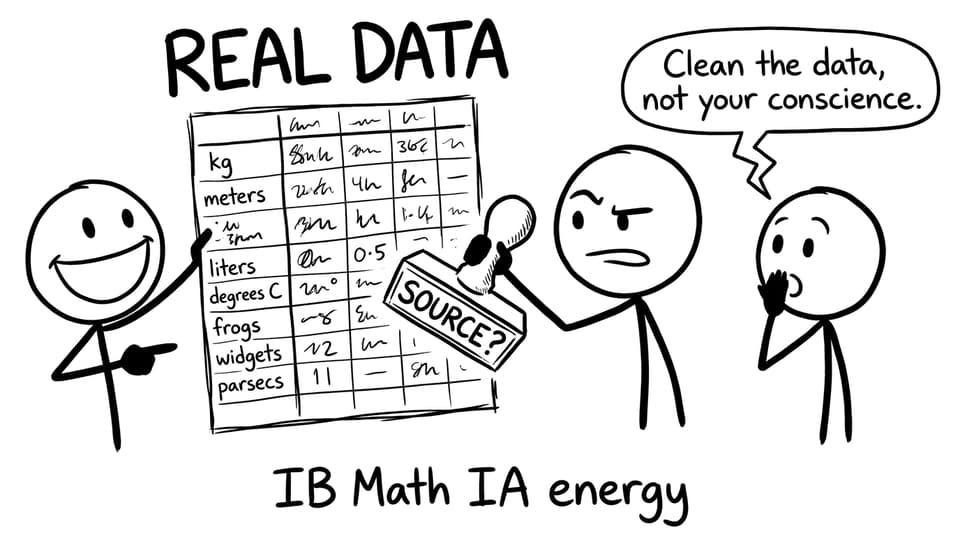
Suddenly, the data has a smell to it: messy units, missing values, weird spikes you can’t explain, and a source link that looks suspiciously like it was last updated in 2013. That is exactly why real data can make your IB exploration feel alive. It proves your mathematics is doing work in the world, not just performing for marks.
But in an IB Math IA, “real” is only impressive when it is also trustworthy, consistent, and analysable. If you want higher marks in Use of Mathematics and Reflection, the goal is simple: make your dataset feel like something a careful person would bet on.
Real-data checklist (save this before you start)
Before you integrate real data into your IB Math IA, run this quick check:
-
Does the data directly support your aim (not just your curiosity)?
-
Can you explain where it came from and why it is credible?
-
Are units consistent and decimals sensible?
-
Have you visualised it before choosing a model?
-
Can you justify outliers instead of hiding them?
-
Do you have enough points to model and evaluate (often 10 to 30 works well)?
If you need a rubric-aligned roadmap while you plan, the RevisionDojo IA Guides hub is the fastest way to align decisions with what IB examiners reward.
Choose data that serves the aim, not the vibe
A common IB mistake is selecting a dataset that is “interesting,” then forcing mathematics onto it later. Examiners feel that instantly.
Instead, write your aim first in one sentence. Then choose data that makes that aim testable.
Example aim:
“This IB exploration models the cooling of a liquid by comparing linear and exponential fits to temperature-over-time measurements.”
Now the dataset has a job: it must include temperature, time, and a controlled way of recording both.
If you are still shaping the skeleton of your exploration, use a structure guide like How to Structure Your IB Math IA Logically so your data decisions slot into a clear narrative.
Use reliable sources (and prove you did)
In an IB Math IA, credibility is not about finding the “most official” website. It is about being transparent:
-
Is the data primary (you measured it) or secondary (you sourced it)?
-
What tool produced it (sensor, app, database, survey)?
-
What are the known limitations (precision, sampling bias, missing values)?
A strong move is to cite the dataset the same way you would cite a diagram or definition. If you are unsure how detailed to be, follow a dedicated referencing guide such as How to Reference Mathematical Sources Properly in the IB Math IA. This is one of the quiet habits that makes an IB IA read “professional.”
Clean and format your data like you respect the reader
Most IB examiners are not marking you down for having an imperfect world. They mark you down for pretending it is perfect.
So clean your data and show the process briefly:
-
Standardise units (minutes vs seconds, dollars vs thousands).
-
Keep decimals consistent (don’t mix 2 d.p. with 7 d.p.).
-
Label columns with units.
-
Decide how you handle missing values (remove, interpolate, explain).
Then present it clearly: a table that can be read without guesswork. Clear formatting is part of mathematical communication, and it supports everything that comes next.
For students who want a full coursework workflow, RevisionDojo’s Coursework Library and exemplars are a helpful calibration tool, especially IB Maths AA IA Examples and IB Maths AI IA Examples.
Plot first, model second (your graph is a decision tool)
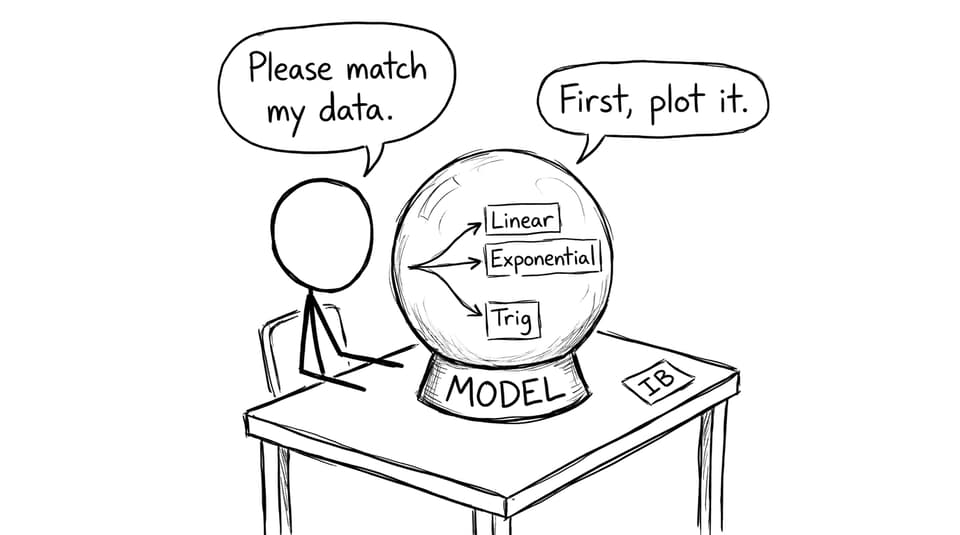
Before you do any regression, plotting is your reality check.
A scatterplot can reveal:
-
whether a linear model is even plausible
-
whether growth slows (logistic-like behaviour)
-
whether variance increases over time
-
whether a few points dominate your fit
This is where many IB students gain marks without adding extra math: you can justify model choices using what the plot shows.
If you need a quick refresher on regression thinking for IB, the AA statistics pages are useful, especially Statistics & Probability and the focused skill page SL 4.10-X on y regression line.
Identify relationships you can actually evaluate
Real data earns its keep when you do two things:
-
Fit a model.
-
Evaluate whether it deserves your trust.
In an IB Math IA, evaluation can be as meaningful as the fitting.
Useful patterns to look for:
-
Linear trend: correlation, least-squares regression, residual plots
-
Curved trend: exponential, logarithmic, polynomial models
-
Periodic trend: trigonometric models and parameter interpretation
Also remember a very IB truth: a strong numerical fit is not the same as a strong real-world model. If you want that idea explained clearly, read Why Do Regression Models Never Fit Perfectly in IB Maths?. It helps you write smarter reflection, especially when your data is noisy.
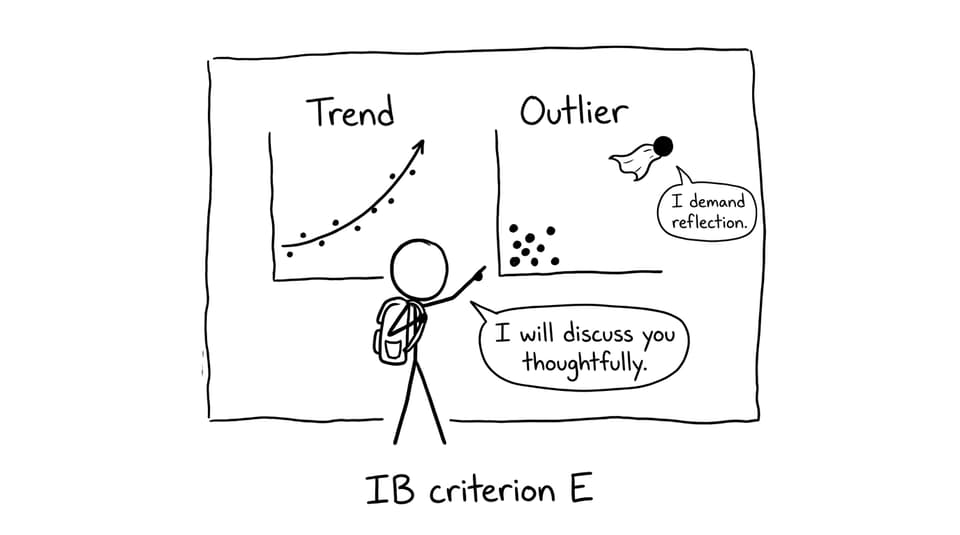
Treat outliers like evidence, not embarrassment
Outliers are not automatically “mistakes.” Sometimes they are the most honest part of your dataset.
A high-scoring IB approach is:
-
Identify the outlier clearly.
-
Suggest a plausible cause (measurement error, external interference, unusual condition).
-
Test impact (compare models with and without it, or discuss residual change).
-
Decide transparently what you will do.
This is reflection that feels earned. And it is exactly where your IA starts sounding like an investigation instead of a worksheet.
Use RevisionDojo tools to tighten the loop (data to marks)
Real talk: the hard part of an IB Math IA is not collecting numbers. It is turning those numbers into a clean argument.
RevisionDojo is built for that loop:
-
Study Notes and Flashcards to refresh regression, statistics, and modeling language fast.
-
AI Chat to sanity-check whether your interpretation matches the math you actually did.
-
Grading tools to test your draft against rubric expectations early (before your teacher does).
-
Coursework Library to compare how strong IAs describe data choices and limitations.
-
Tutors when you need a human to help you tighten scope without losing originality.
And while your IA is only part of the journey, don’t forget you are also preparing for IB exams. The same modeling skills come up again, and the best practice is targeted: the Statistics & Probability Questionbank helps you drill exactly what you keep using in your IA.
Closing: make the data earn its place
In an IB Math IA, real data is not decoration. It is a promise: that your mathematics will meet reality and still hold up.
If you want your exploration to feel credible, start by choosing data that matches your aim, clean it like a researcher, plot before you model, and reflect honestly on limitations. Then use RevisionDojo to tighten every step: the IA Guides for direction, the Coursework Library for calibration, the Grading tools for rubric accuracy, and the Study Notes, Flashcards, AI Chat, and Tutors to keep your work both confident and correct.
Your numbers already have a story. Make it readable. Make it defensible. Make it IB.