A teacher once told my class: “Your math can be brilliant and still lose marks if the reader has to work to understand it.”
That is the quiet truth of the IB Math IA. A graph is not decoration. It is a claim you are making in visual form. If your axes are vague, your caption is missing, or your colors collapse into gray the moment someone prints the PDF, your argument starts to wobble.
This guide shows you how to format and label graphs professionally in the IB Math IA, with a checklist you can apply in minutes.
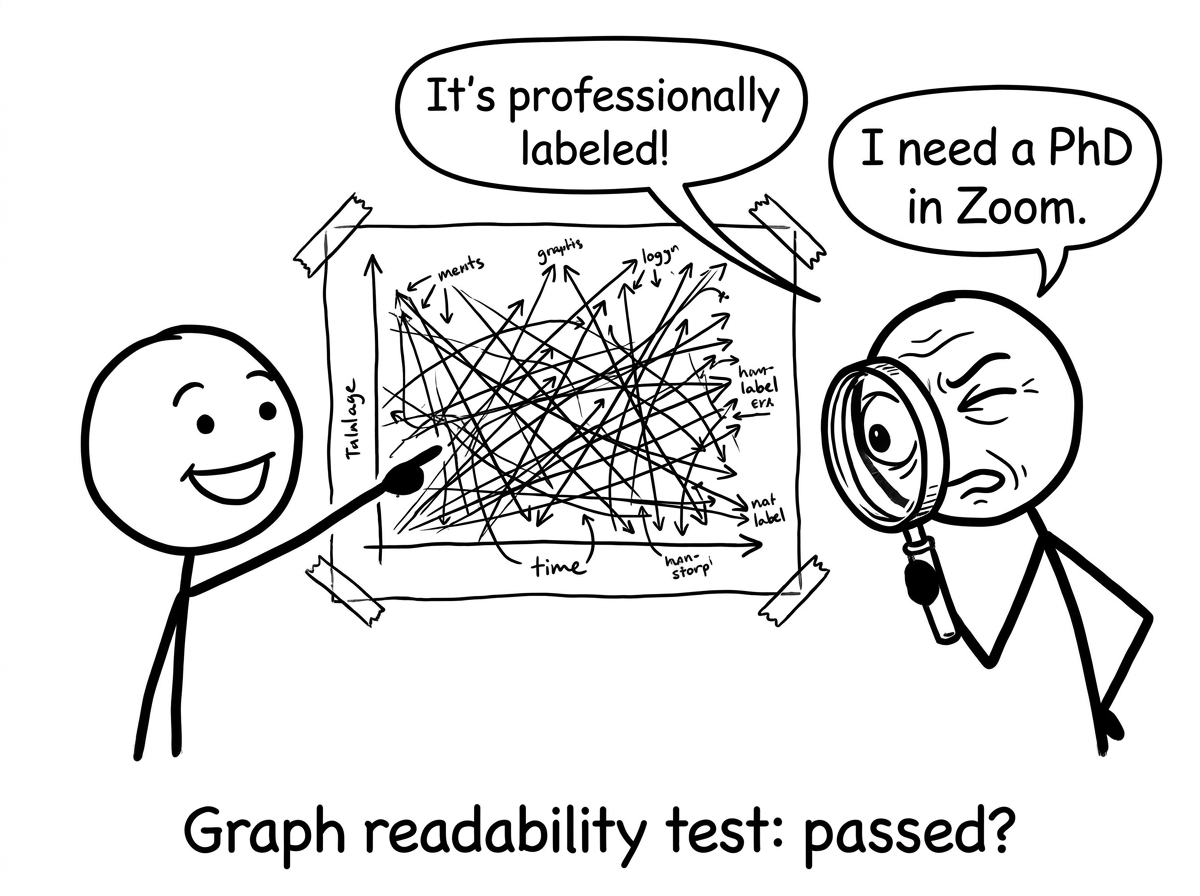
Student vs examiner graph readability
The IB graph checklist you should run every time
Before you paste a figure into your draft, pause and confirm:
Graph type matches purpose (relationship, distribution, model fit)
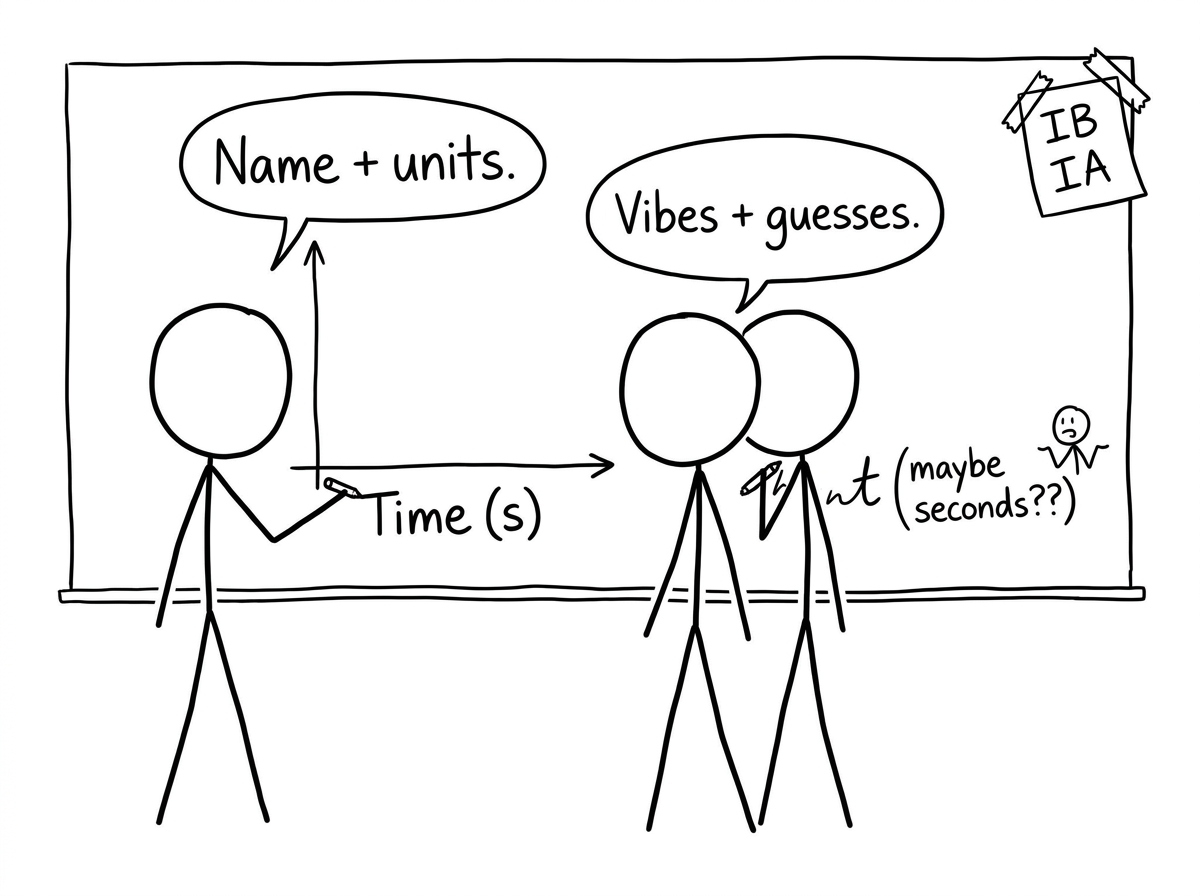
Axes are labeled with variable name + unit
Scale is sensible (not distorted, not zoomed so far it hides variation)
Title and caption are meaningful (not “Graph 1”)
Figure is numbered and referenced in your writing
Key features are annotated (turning points, intersections, anomalies)
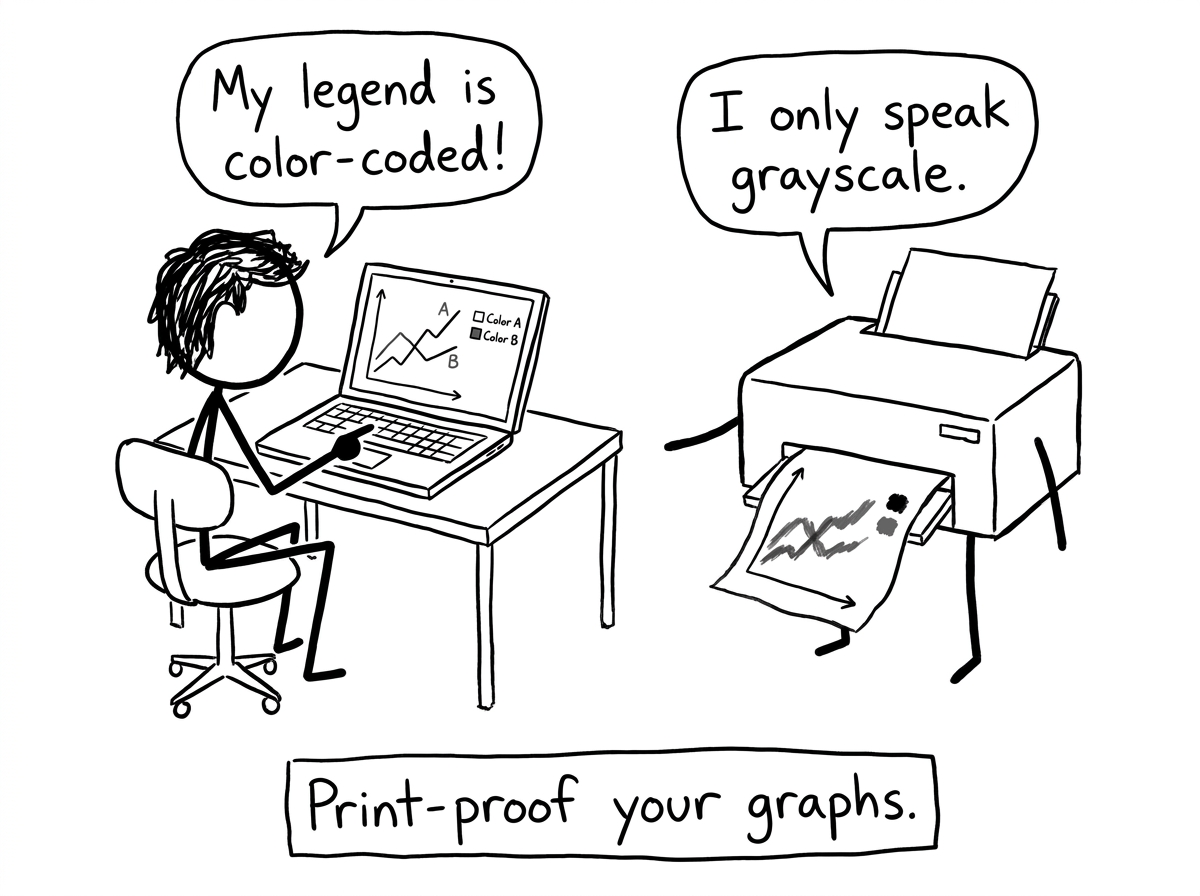
Legend is readable and still works in black and white
Parametric plot: motion paths, relationships defined indirectly
If you are unsure whether a figure belongs in the main body, use the “15-second test”: cover your text and look only at the graph. If you cannot say what conclusion it supports within 15 seconds, it probably needs a better caption, clearer labels, or it belongs in an appendix.
Label axes like an IB examiner is scanning for errors
Axis labeling is where professionalism becomes obvious.
What “good” looks like
Variable name written clearly
Unit in parentheses
Consistent symbols with your algebra in the text
Example:
Time (s)
Temperature (°C)
What quietly loses clarity
Just “x” and “y” with no meaning
Units sprinkled in the caption instead of on axes
Switching between “t” and “time” depending on mood
When your IA gets longer, consistency becomes harder to maintain. RevisionDojo helps by keeping your learning loop tight: use AI Chat to sanity-check notation, then lock definitions into your Study Notes and Flashcards so you stop re-deciding labels each time you revise.
Axis labels: name+units vs vibes
Titles, figure numbers, and captions that sound like you know what you’re doing
In the IB IA, a title should describe the relationship, not just the object.
Weak: “Graph 2”
Strong: “Figure 2. Exponential decay model of temperature vs time with best-fit curve.”
A simple template that works:
Figure X. [What the reader is seeing] + [context] + [model/feature].
Then, in your body text, reference it with purpose:
“As shown in Figure 2, the data follows an exponential pattern, supporting the model (T(t)=T_0e^{-kt}).”
A consistent color palette (or line style palette)
This is also where RevisionDojo’s ecosystem matters. If you are practicing graph interpretation for exams, run topic drills in the Questionbank for functions, modeling, and statistics, then use Grading tools to see how explanations are rewarded. For targeted practice workflows, try How to Use the Questionbank for Targeted Math Revision.
Scale, gridlines, and the “print-to-PDF” reality check
Bad scaling doesn’t look like a mistake. It looks like a vague conclusion.
Use uniform increments
Avoid dramatic zoom that exaggerates small differences
Use gridlines only if they improve readability
Most importantly: export to PDF and zoom out to 80% view. If your labels vanish, they were never really there.
And do a black-and-white check. Many IB submissions are viewed or printed without perfect color fidelity.
Printer vs color legend joke
Annotate what matters (and delete what doesn’t)
Annotations are not a decoration layer. They are your reflection made visible.
Use short, precise callouts for:
Turning points and maxima/minima
Intersections (especially if they are used later in algebra)
Outliers and anomalies (with a sentence on why they might exist)
Model fit information (parameters, (R^2), residual patterns if relevant)
If you have many graphs, don’t let them pile up like receipts. Use a tighter selection and write better around them. This guide helps: How Many Graphs Should an IA Include?.
Quick RevisionDojo workflow for cleaner graphs and better exam prep
Professional graphs help your IA. The same habits also help you prepare for IB exams.
Use Study Notes to refresh the math behind the model you are graphing
Drill interpretation and modeling with the Questionbank
Use AI Chat to test whether your caption actually explains meaning
Run Mock Exams and Predicted Papers to practice reading graphs under time pressure
Check your draft with Grading tools for communication and presentation marks
Compare style against the Coursework Library and, if you want human feedback, book Tutors
How professional do graphs need to be for the IB Math IA?
Professional in the IB sense means “clear enough that the math is easy to follow.” It does not mean fancy design, unusual fonts, or artistic styling. Your graph should be understandable even if someone only reads the figure and its caption. That is why axes labels, units, and a descriptive caption matter more than color gradients. If your graph looks clean at normal zoom and still works when printed to PDF, you are already ahead. When in doubt, prioritize readability over aesthetics, because examiners reward communication.
Can I use color in my IB IA graphs?
Yes, color is fine in an IB IA, but you need to assume your reader might view it in grayscale. That means you should combine color with other cues, like different marker shapes, dashed vs solid lines, or clear labeling directly on the curve. Legends should be large enough to read without zooming in aggressively. You should also avoid using two colors that become similar gray tones when printed. A quick test is exporting to PDF and printing (or previewing) in black and white before final submission.
Do graphs count toward the IA word limit, and how should I reference them?
In the IB Math IA, the graph itself typically does not count as words, but your caption and the discussion around it do. That is actually a useful constraint because it forces you to be selective and purposeful. Reference each figure directly in the text, ideally when you extract meaning from it, not after. Write sentences that connect the graph to your model, your assumptions, or your evaluation. If a graph is never referenced, it usually should not be in the main body. Treat each figure like evidence introduced in a story: it arrives exactly when the reader needs it.
Conclusion: make your graphs feel inevitable
In the IB Math IA, a professional graph is one that makes your conclusion feel unavoidable. The labels are calm. The scales are honest. The caption tells the reader what to notice. And your writing points to the figure as evidence, not as decoration.
If you want one place to tighten all of this, build your feedback loop in RevisionDojo: practice graph-heavy topics in the Questionbank, refine explanations with AI Chat, check presentation with Grading tools, and benchmark against the Coursework Library. Your graphs will look better, and your exam prep will get sharper at the same time.
· 6 min read
IB Sleep During Exams: A Calm, Practical Routine
IB sleep during exams can raise scores more than late cramming. Use a simple night routine, reduce anxiety, and revise smarter with RevisionDojo.