


A score tells you what happened. A useful dashboard helps explain what should happen next.
Yes, RevisionDojo provides analytics for IB teachers through RevisionDojo for Schools. The teacher dashboard brings together class-level progress, assignment results, curriculum coverage, and student strength-and-weakness data. Teachers can use these insights to identify struggling learners, find weak topics within a subject, and assign more focused practice.
For students, this matters because analytics should not produce another number to worry about. Used well, they produce a clearer revision decision: which concept to relearn, which command term to practise, or which timed skill deserves attention today.
The wider RevisionDojo for Schools platform connects those insights with examiner-written resources, assignments, auto-grading, a Questionbank, Test Builder, Predicted Papers, and coursework feedback. The result is a feedback loop rather than a static report.
RevisionDojo teacher dashboard at a glance
Here is the practical answer for students and teachers:
- Class-level progress: Teachers can review performance across a class instead of assembling results manually.
- Individual strengths and weaknesses: Student-level views help distinguish a shared class gap from an individual difficulty.
- Topic and learning-objective visibility: Teachers can see where understanding or curriculum coverage requires attention.
- Assignment results: Auto-graded work creates faster evidence for follow-up teaching.
- Subject-level analysis: Performance can be interpreted within the structure of each IB subject and its assessed skills.
- Targeted action: Teachers can respond with focused questions, custom tests, mini-lessons, or differentiated support.
- Broader school insight: Coordinators can examine patterns across subjects, departments, or cohorts where their access permits it.
The central idea is simple: the dashboard does not replace a teacher's judgment. It gives that judgment better evidence.
What analytics can IB teachers see?
RevisionDojo's schools page currently describes assignments and progress tracking down to the learning objective, AI grading, and student strength-and-weakness analytics. Its teacher resources also explain that information can be organized by student, class, or subject area.
That creates three useful levels of interpretation.
| View | Question it helps answer | Possible teacher response |
|---|---|---|
| Individual student | Where does this learner need help? | Assign a focused drill or explain a misconception |
| Class | Which weakness appears repeatedly? | Reteach a topic or model a stronger response |
| Subject or cohort | Is a broader pattern emerging? | Review sequencing, resources, or intervention plans |
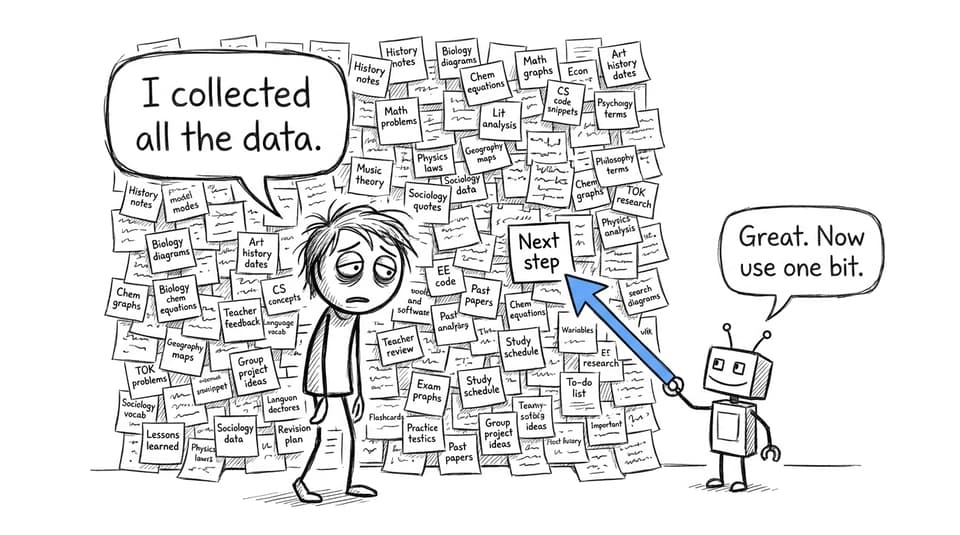
A teacher might notice that a class performs well on recall questions but struggles when asked to evaluate. Another class could understand the content but lose marks through timing. The average score alone may make those situations look similar. Their remedies are not.
This is why using data to improve IB learning works best when teachers look beneath the headline result. A weak outcome may come from missing knowledge, misunderstood command terms, limited application, incomplete working, or poor pacing. Analytics narrow the investigation; teachers interpret the cause.
That distinction aligns with the IB's published assessment principles. Formative assessment is intended to reveal strengths and weaknesses and guide subsequent teaching and learning. Data becomes educationally valuable when it changes the next action.
How class-level dashboards reveal weak areas by subject group
IB subjects do not reward exactly the same combinations of knowledge and skill. A weakness in Mathematics may appear in algebraic reasoning or incomplete working. In the sciences, students may understand a concept but mishandle data analysis. Individuals and societies can expose difficulties with evaluation or evidence, while language subjects may reveal weaknesses in interpretation, structure, or expression.
The class-level dashboard helps teachers examine performance inside the relevant subject rather than treating every low score as the same problem. At school level, authorized coordinators can use wider analytics to look for patterns across subject areas and cohorts. This broader view is useful, but comparisons must remain careful: a score in one subject group is not automatically equivalent to the same score in another.
A sensible review process looks like this:
- Select the class and subject. Begin with a defined group rather than a school-wide average.
- Find the recurring weakness. Look for a topic, objective, task type, or assessed skill that repeatedly causes difficulty.
- Separate shared and individual gaps. A pattern affecting most of the class calls for a different response from one affecting two students.
- Check the evidence. Review actual answers and feedback before deciding why the problem exists.
- Assign a small intervention. Use a targeted question set, explanation, mini-lesson, or timed task.
- Measure again. New practice should show whether the intervention helped.
This is more useful than labelling a whole group as “weak.” It turns a broad concern into a teachable target. RevisionDojo's guidance on tracking IB progress without spreadsheets explores how this ongoing cycle can reduce fragmented record-keeping.
What teacher analytics mean for students
Students may hear “teacher analytics” and imagine surveillance. A better analogy is a map. The map does not decide where you go, but it makes expensive wrong turns easier to avoid.
If class data shows a shared misconception, your teacher can reteach it before everyone repeats the error under exam conditions. If your difficulty is individual, the response can be more precise. You may receive a different Questionbank set, an explanation through AI Chat, or a short Test Builder activity focused on the exact objective.
The benefit is not that revision becomes effortless. It becomes less random.
Students can strengthen that process by using the platform consistently. Analytics based on a narrow or careless sample can only show a narrow or careless sample. Attempt questions honestly, submit complete reasoning, review feedback, and revisit weak areas. One difficult result is a data point, not an identity.
The RevisionDojo app revision workflow connects Study Notes, Flashcards, Questionbank practice, AI Chat, Grading tools, Mock Exams, Predicted Papers, the Coursework Library, and Tutors. Each serves a different purpose:
- Study Notes and AI Chat clarify a concept.
- Flashcards strengthen retrieval.
- Questionbank practice develops application and exam technique.
- Mock Exams and Predicted Papers test pacing and stamina.
- Grading tools and the Coursework Library support criterion-aware coursework improvement.
- Tutors provide human guidance when a pattern needs deeper diagnosis.
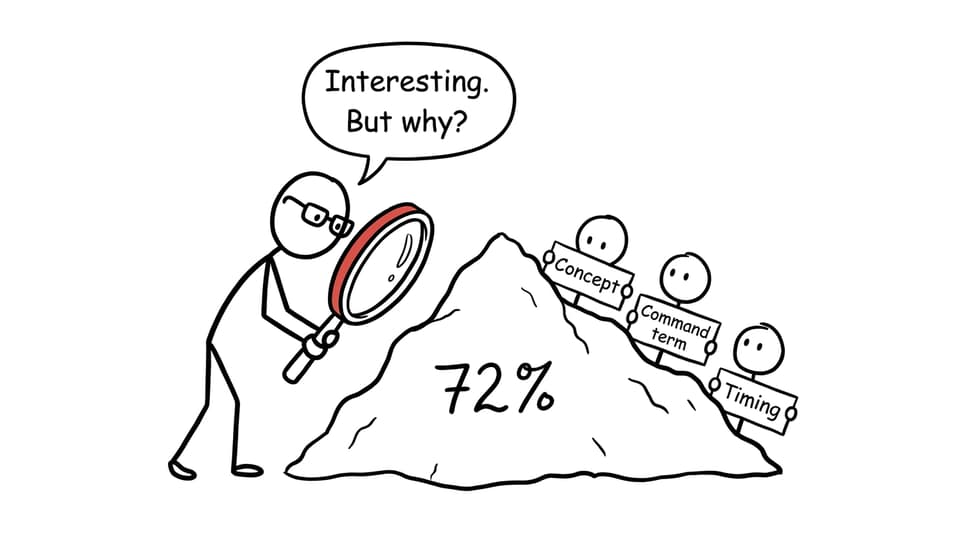
The strongest routine moves from insight to action quickly. Do not spend half an hour admiring a progress graph. Choose one weakness and work on it.
How teachers can turn dashboard insights into better revision
A dashboard earns its place only when it changes instruction. RevisionDojo's teacher analytics guide recommends defining a goal, assigning targeted practice, reviewing class data, personalizing feedback, and adjusting subsequent teaching.
For exam preparation, that cycle can be compact:
Establish a meaningful baseline
Teachers can assign a short set aligned with the current unit or a specific assessed skill. A focused baseline often produces more actionable evidence than one large mixed assessment because its purpose is clear.
Diagnose before prescribing
A wrong answer does not explain itself. Teachers should inspect student work, speak with learners, and consider whether the cause is knowledge, interpretation, technique, or time. The official IB approach treats assessment evidence as part of an ongoing, responsive process rather than a substitute for teacher-student dialogue.
Match the intervention to the weakness
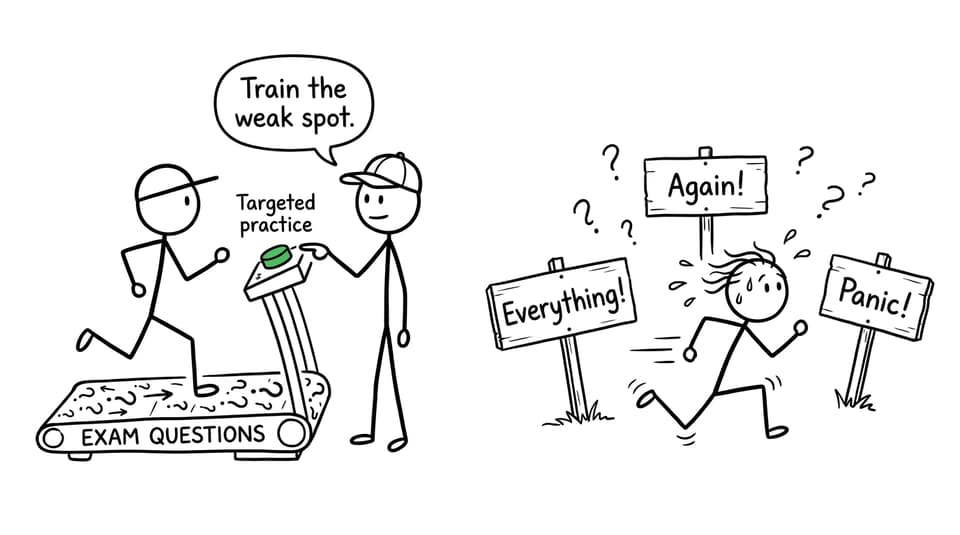
A knowledge gap may call for a mini-lesson and Flashcards. An application problem needs worked examples followed by fresh questions. Poor pacing requires timed practice. Weak responses to command terms need explicit modelling and comparison with the assessment criteria.
Teachers can build focused practice through custom IB mock exams by topic. Students preparing independently can apply the same logic through the IB Questionbank practice guide.
Recheck the same skill
Without another measurement, intervention becomes guesswork. A short follow-up task can show whether the class improved, remained stuck, or developed a different misunderstanding. Progress matters more than one isolated result.
What analytics cannot tell teachers on their own
Analytics are evidence, not omniscience. They cannot automatically explain tiredness, anxiety, unfamiliar wording, a rushed attempt, or a learner's reasoning. Nor should a dashboard result be treated as a final prediction of an IB grade.
Three cautions matter:
- Data quality depends on participation. Incomplete attempts can distort the picture.
- A class average can hide variation. Teachers should examine distributions and individual responses.
- Numbers need context. Conversations, written work, observations, and student reflection remain essential.
This is especially important when supporting mixed-attainment classes. RevisionDojo's article on supporting struggling students without limiting high achievers shows why differentiated tasks are more useful than one universal response.
From dashboard insight to exam readiness
The value of RevisionDojo for teachers is not the existence of another screen. It is the connection between evidence and resources. Teachers can see a weakness, assign relevant work, review the response, and adjust. Students can understand why they are practising something instead of moving through revision by instinct.
Begin with one class, one subject, and one clearly defined question: Which weakness, if improved this week, would make the greatest difference?
Then use RevisionDojo as the complete IB resource around that answer. Move from Study Notes to Flashcards, from the Questionbank to timed Mock Exams, and from AI feedback to teacher or Tutor guidance when needed. The dashboard points toward the work. Consistent, focused practice is what turns that direction into progress.