




A transition matrix records the probabilities of moving between states in a Markov chain. In IB Mathematics: Applications and Interpretation HL, columns represent the current state, rows represent the next state, and the state after n transitions is found using sₙ = Tⁿs₀. You may also need to interpret long-term or steady-state behaviour.
The arithmetic is rarely the hardest part. Most errors happen one step earlier: a probability is placed in the wrong position, the state order changes halfway through, or a calculator answer is reported without context. This guide gives you a reliable method for avoiding those mistakes.
What you need to know
Transition matrices and Markov chains appear in AHL 4.19, so this is additional higher level content for IB Mathematics: Applications and Interpretation. Before attempting exam questions, make sure you can:
- identify the states and keep their order consistent
- translate a transition diagram or written description into a matrix
- check that every probability is between 0 and 1
- check that each column adds to 1 under the IB column-vector convention
- calculate one or several transitions
- find and interpret a steady-state vector when it exists
- use technology efficiently without hiding the mathematical setup
If matrix multiplication itself feels uncertain, review the Introduction to Matrices Questionbank before moving into probability models.
How a transition matrix works
Suppose customers choose either café A or café B each week. Of the customers currently at A, 80% return to A and 20% move to B. Of those currently at B, 30% move to A and 70% remain at B.
Using the state order A, B, the model is:
        Current
          A     B
Next A  0.8   0.3
     B  0.2   0.7
Therefore:
T = [0.8  0.3]
    [0.2  0.7]
The entry in row i and column j is the probability of moving from state j to state i. A useful memory aid is: columns are current; rows receive the next state.
Each column sums to 1 because every person currently in a state must go somewhere in the model. The first column describes customers currently at A: 0.8 + 0.2 = 1. The second describes customers currently at B: 0.3 + 0.7 = 1.
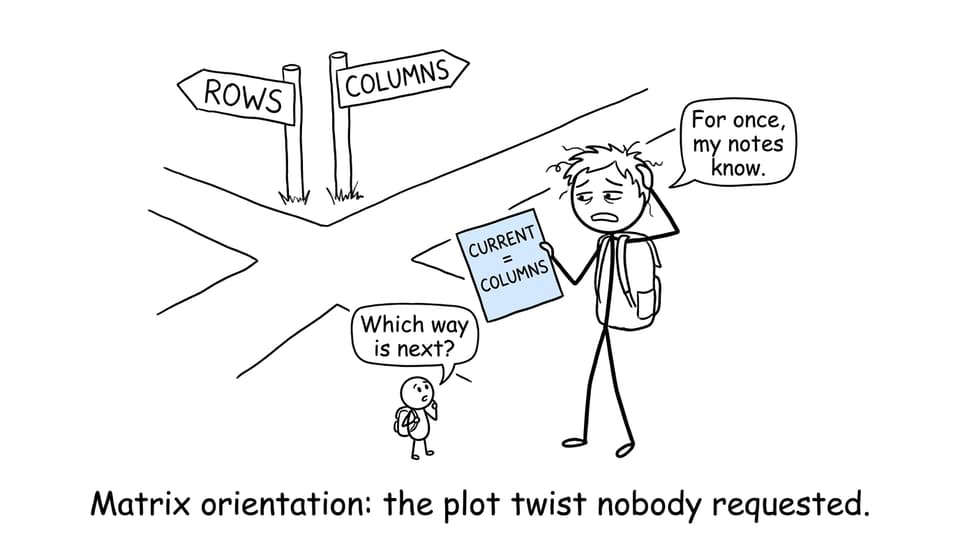
Outside sources sometimes use row vectors and matrices whose rows sum to 1. That convention is mathematically valid, but mixing it with the IB column-vector setup produces incorrect answers. Follow the notation established in your question and course materials. RevisionDojo's AHL 4.19 transition matrices and Markov chains resources provide focused notes, questions and flashcards for this syllabus point.
Worked example: calculating future states
Assume café A initially has 70% of the customers and café B has 30%. Write the initial state as a column vector:
s₀ = [0.7]
     [0.3]
After one week:
s₁ = Ts₀

   = [0.8  0.3][0.7]
     [0.2  0.7][0.3]

   = [0.65]
     [0.35]
So the model predicts that 65% of customers will choose A and 35% will choose B after one transition.
After two weeks:
s₂ = T²s₀ = Ts₁

   = [0.8  0.3][0.65]
     [0.2  0.7][0.35]

   = [0.625]
     [0.375]
If the question asks for the state after n transitions, use:
sₙ = Tⁿs₀
The exponent counts transitions, not labels on a calendar. If s₀ represents the situation now, then T³s₀ represents the state after three transitions. For broader topic practice, the IB Math AI Questionbank lets you isolate matrix and probability questions rather than revising randomly.
Finding the steady state
A steady-state vector s remains unchanged after another transition:
Ts = s
Let the long-term proportions for cafés A and B be x and 1 - x. Using the first row of the matrix:
x = 0.8x + 0.3(1 - x)
x = 0.8x + 0.3 - 0.3x
0.5x = 0.3
x = 0.6
The steady-state vector is therefore:
s = [0.6]
    [0.4]
Check it rather than trusting the algebra:
Ts = [0.8  0.3][0.6] = [0.6]
     [0.2  0.7][0.4]   [0.4]
The interpretation matters: in the long run, this model approaches 60% at café A and 40% at café B. It does not mean every real customer follows a predictable route. It describes the modelled proportions or probabilities under fixed transition rules.
Not every Markov chain automatically approaches one unique limiting distribution. In the regular chains normally used for this type of calculation, repeated transitions approach a stable vector. If you estimate it using a large power such as T¹⁰⁰, explain what the resulting values represent.

How transition matrices appear in exam questions
A structured question may ask you to complete several linked tasks:
- construct T from percentages or a transition diagram
- find a missing probability using a column sum of 1
- write the initial state vector
- calculate Tⁿs₀ for a stated value of n
- determine a steady-state distribution
- convert proportions into expected numbers
- interpret an answer in the original context
Write the matrix and state vector before using your calculator. This earns clarity, makes your convention visible and reduces input errors. Keep full calculator precision during intermediate work, then round only at the end according to the question.
If a population contains 2,000 customers and your result is [0.625, 0.375]ᵀ, the corresponding modelled numbers are 1,250 and 750. Probabilities should remain between 0 and 1, while population counts should be sensible whole numbers when the context requires them.
Use the Statistics and Probability topic hub to connect Markov chains with the wider AI HL syllabus. When the individual method is secure, move from targeted practice into IB Math mock exam preparation.
Common exam mistakes
Reversing rows and columns
Do not place a probability according to how the sentence happens to be written. Label the top of the matrix current and the side next, then place each value deliberately.
Changing the state order
If the matrix uses A, B, the state vector must also use A, B. Writing [B, A]ᵀ silently changes the meaning of every calculation.
Using Ts₀ when several transitions are required
Ts₀ gives one transition. After n transitions, calculate Tⁿs₀. Write a short timeline if the wording includes dates or months.
Assuming a large power is self-explanatory
Calculator output is not a complete interpretation. State what each component represents, include the relevant time period and use percentages or counts appropriately.
Rounding too early
Repeated matrix multiplication can magnify premature rounding. Store the matrix and vector in your calculator, retain full precision and round the final result.
Quick-reference summary
| Task | Reliable method |
|---|---|
| Build the matrix | Columns are current states; rows are next states |
| Validate T | Entries are from 0 to 1 and each column sums to 1 |
| Find the next state | Calculate s₁ = Ts₀ |
| Find the state after n steps | Calculate sₙ = Tⁿs₀ |
| Find a steady state | Solve Ts = s with components summing to 1 |
| Check a steady state | Substitute it back into Ts |
| Finish an exam answer | Interpret components in context and round appropriately |
Turn recognition into exam performance
Knowing the formula is only the beginning. A stronger revision loop is to study one example, reproduce the setup without looking, complete several targeted questions, classify each error and try the missed questions again. The guide on using IB Maths topic notes effectively explains how to make that cycle active rather than repetitive.
RevisionDojo brings that process together. Use Study Notes and concept videos to build understanding, Flashcards for definitions, the Questionbank for focused drills, and AI Chat or Grading tools to diagnose weak reasoning. Then test your timing with Predicted Papers and Mock Exams. The Coursework Library and Tutors provide further support when you need to connect mathematical modelling with clear communication.
A transition matrix is ultimately a compact story about movement. Label that story carefully, preserve the state order and interpret the final vector. Once those habits become automatic, the calculator work becomes the easy part.