
Data analysis in IB Group 4 Paper 2 has a particular kind of pressure: the numbers are calm, but your brain isn’t. One moment you’re reading a tidy table; the next you’re defending a conclusion like it’s a courtroom drama. The good news is that strong data analysis is less about brilliance and more about reliable habits. These Exam Tips are designed to help you read what’s actually on the page, respond to what the markscheme rewards, and stay steady whether you’re in Biology, Chemistry, Physics, or ESS.
A quick Paper 2 data analysis checklist (save this)
Use this mini routine before you write anything. It’s simple, but it prevents the most expensive mistakes.
-
Identify the command term (describe/explain/evaluate)
-
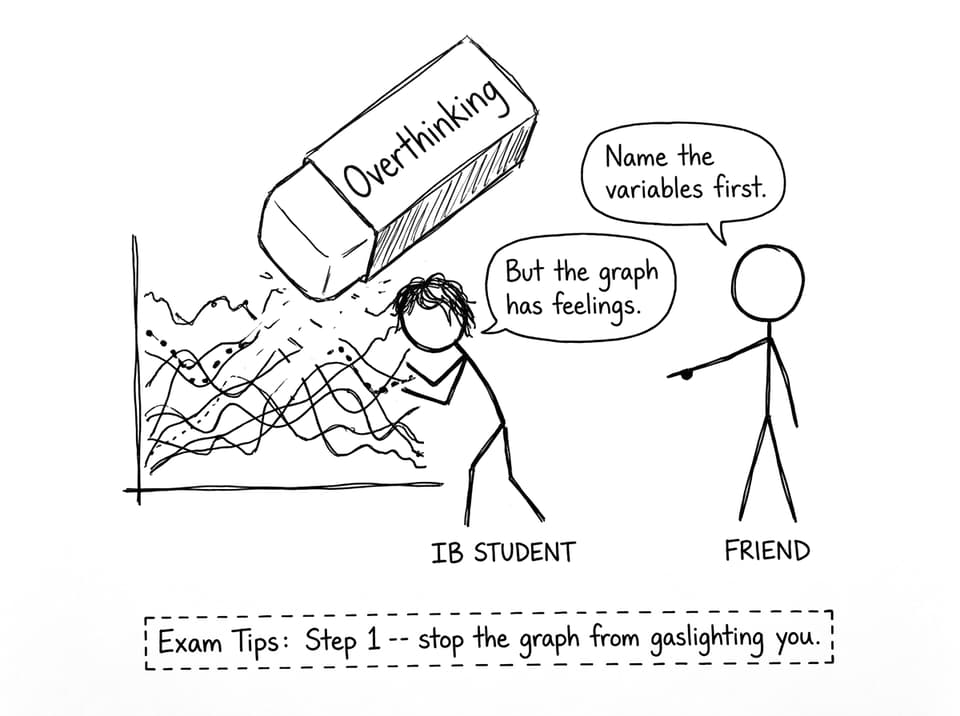
Name the independent and dependent variables
-
Check units, scales, and whether axes start at zero
-
Describe the trend with at least one number
-
Explain the trend using correct theory
-
Comment on anomalies and limitations if asked
If you want a broader Paper 2 strategy alongside these Exam Tips, keep Paper 2 long question answer advice open while you practice.
Exam Tips for reading graphs like an examiner
A graph is a story with strict rules. Examiners don’t reward “vibes”; they reward precision.
Start with the boring details (they’re not boring in the markscheme)
Before trends, check labels, units, and scale. Many students lose marks by describing a trend correctly but in the wrong units, or ignoring that the x-axis is logarithmic. Treat axes like instructions, not decoration.
A helpful habit is to write a one-line translation: “As (IV) increases from ___ to ___, (DV) changes from ___ to ___.” This forces clarity and naturally sets up your explanation.
Describe first, explain second
In Paper 2, “describe” means what you can see. “Explain” means the science behind what you see. Mixing them often creates a paragraph that feels intelligent but scores poorly.
To train that separation, do timed sets using RevisionDojo’s Questionbank feature, then review whether each sentence was observation or theory. That’s one of the fastest ways to turn Exam Tips into marks.
Exam Tips for trends, anomalies, and “weird points”
Most marks live in three places: trend, evidence, and interpretation.
Quantify the trend
Don’t say “increases a lot.” Say “increases from 2.0 to 4.5 mol dm⁻³” or “gradient becomes steeper after 30°C.” One number can transform a vague sentence into a mark-winning one.
Handle anomalies without panic
If one point breaks the pattern, name it calmly and propose a reason only if asked. “The reading at 40°C is lower than expected and may be due to measurement error or uncontrolled variables.” It’s measured, not dramatic.
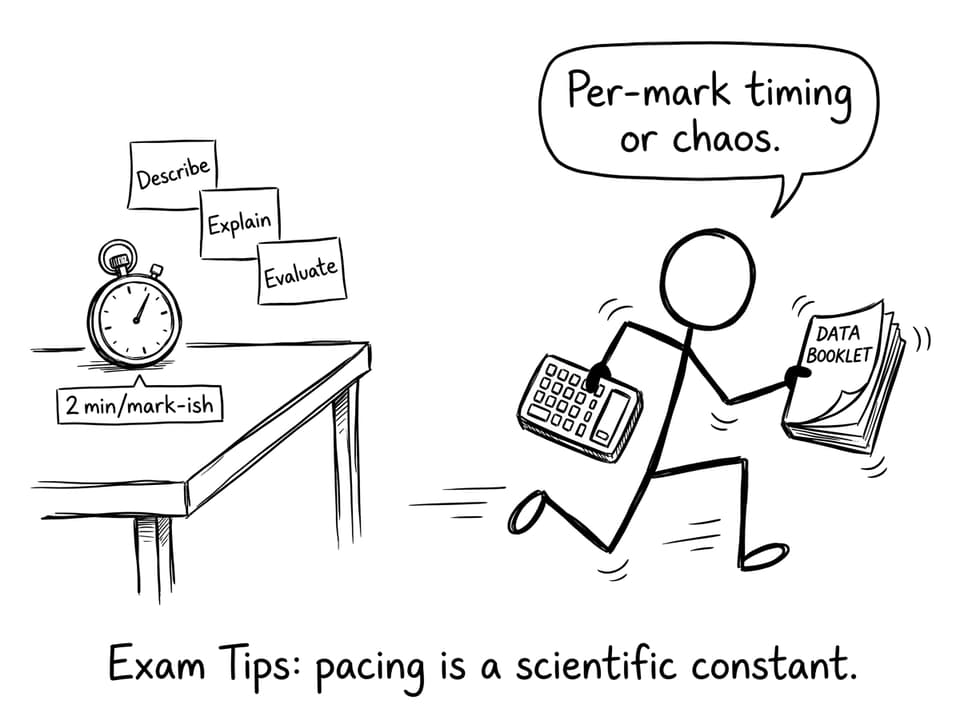
If time pressure is your main enemy, pair these Exam Tips with time management for IB Group 4 science exams and practice pacing weekly.
Exam Tips for calculations: units, sig figs, and free marks
Calculations in data analysis aren’t just math. They’re communication.
-
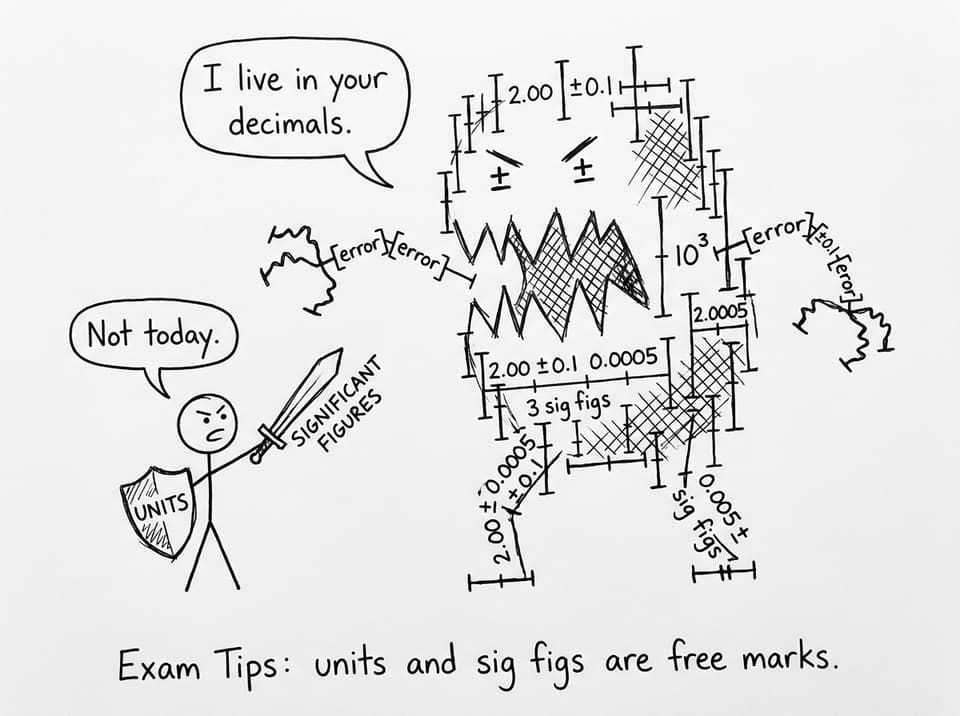
Carry units through every step
-
Use appropriate significant figures (match the data)
-
State formulas when needed, even briefly
This overlaps with IA-style rigor, so it’s worth reading RevisionDojo’s guide on IA data analysis to sharpen habits that also help in Paper 2.
How to practise these Exam Tips with RevisionDojo
Good technique sticks when you repeat it under realistic conditions.
-
Build content confidence using RevisionDojo’s IB Biology resources (the same approach applies for Chemistry and Physics)
-
Drill data questions in the Questionbank, then use AI Chat to clarify why a trend happens
-
Turn repeated mistakes into Flashcards (command terms, definitions, common graph phrasing)
-
Run short timed blocks with Mock Exams and Predicted Papers to make the method automatic
-
If you’re stuck on a specific skill, use Tutors for targeted feedback rather than generic revision
For a wider science revision routine that supports these Exam Tips, this summer plan for IB science is a solid structure.
Closing: calm method beats clever guessing
Paper 2 data analysis rewards a student who stays calm and systematic. Name variables. Read units. Quantify trends. Explain with just enough theory. Repeat until it feels ordinary. If you want these Exam Tips to become automatic, build a weekly loop in RevisionDojo: Study Notes for understanding, Flashcards for recall, Questionbank for precision, and Mock Exams plus Predicted Papers for stamina. Your goal isn’t to “get better at graphs.” It’s to become the kind of student who sees data and immediately knows what to do.