Your first SEHS lab feels harmless until you look at the spreadsheet.
A few columns of heart rate data. A handful of trial times. Maybe a VO₂ estimate that seems to change depending on who held the stopwatch.
Then the quiet panic arrives: Wait… this is math.
That moment is the hidden gift of IB SEHS. Because while Sports, Exercise and Health Science is about bodies, training, and performance, it’s also about something more universal: making decisions when reality is messy. And that is exactly what math and statistics were invented for.
In this post, you’ll see how IB SEHS complements Math and Statistics in a way that makes both subjects feel less abstract, more practical, and honestly easier to revise for.
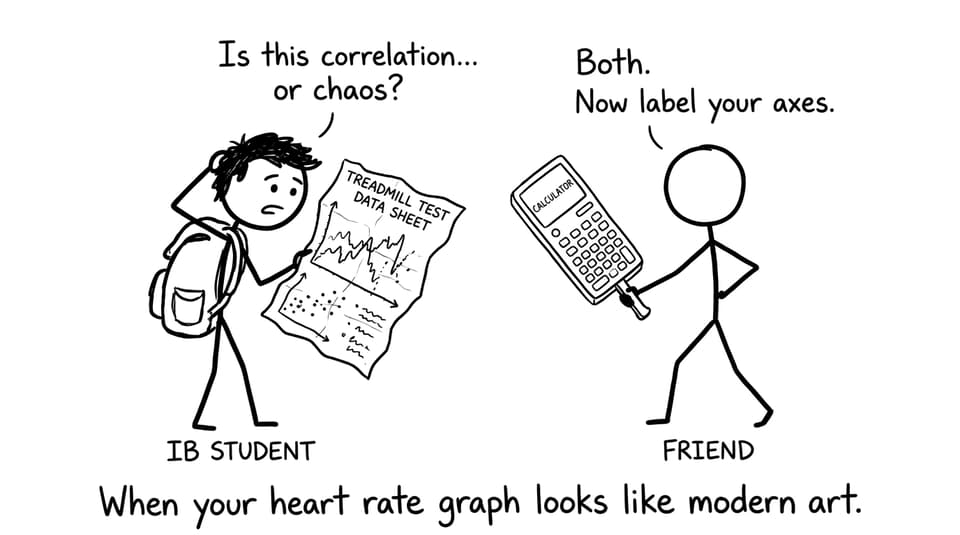
When your heart rate graph looks like modern art.
Quick checklist: where math shows up in IB SEHS
If you want a fast way to spot the overlap, look for these in your next IB SEHS session:
Collecting data with consistent units and controlled variables
Using mean, range, and standard deviation to summarize performance
Reading graphs (and not getting tricked by axes)
Testing reliability, validity, and sources of error
Interpreting correlation without claiming causation
Making evidence-based conclusions under exam-style wording
In IB SEHS, you’re rarely asked to admire a number on its own. You’re asked what the number means.
That starts with how you collect data. A small change in method (timing gates vs. stopwatch, same tester vs. multiple testers, warm-up length, time of day) can shift results enough to change your conclusion. That’s the same mindset statistics demands: before you calculate anything, you check whether the data deserves your trust.
When you revise, practise asking three statistical questions every time you see results:
Is the sample size large enough to support the claim?
Are there clear outliers, and can you explain them?
Would repeating the trial likely produce similar results?
If you’re also taking Math AI, the language overlaps heavily with SL 4.1 Introduction to Statistics notes, especially around sampling, bias, and interpreting variation.
Graphs: the shared language of performance and probability
Graphs are where IB SEHS and math stop being separate subjects.
A heart rate curve over time is basically a story about intensity and recovery. A scatterplot of training volume vs. performance is a story about correlation and noise. And a bar chart of macronutrient intake is a story about proportions pretending to be simple.
SEHS rewards students who can read graphs, not just draw them. That’s why revision should include deliberate graph practice:
Explain what happens when intensity increases (trend + reason)
Compare groups without overclaiming
Identify anomalies and propose realistic explanations
For biomechanics-heavy graph work, revise alongside topic pages like B.2 Forces, motion and movement, where relationships between force, motion, and technique often become visual.
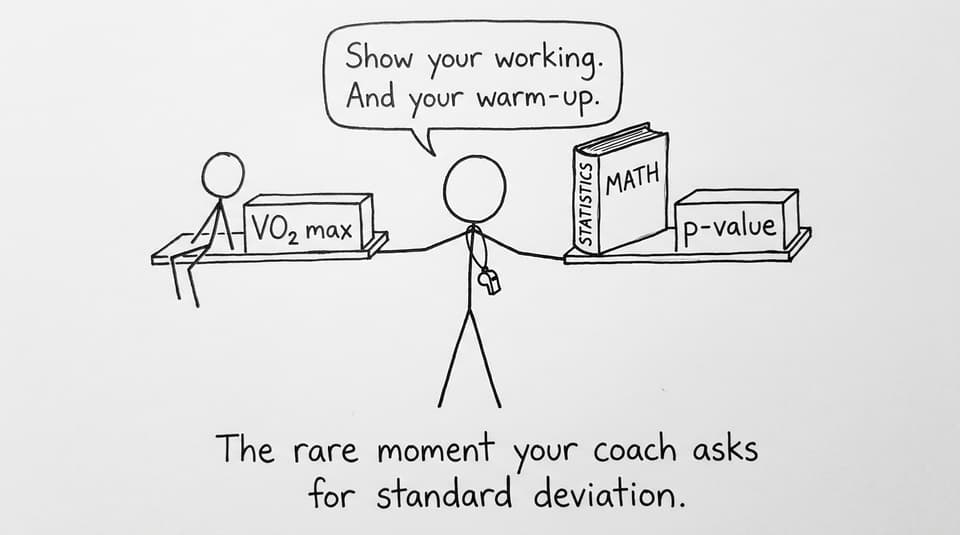
The rare moment your coach asks for standard deviation.
Reliability, significance, and the calm power of “it depends”
There’s a phrase that shows maturity in both statistics and IB SEHS:
“It depends.”
Not as a dodge, but as discipline.
When your results don’t perfectly match your hypothesis, SEHS doesn’t want drama. It wants interpretation: measurement limits, biological variability, uncontrolled variables, and whether your method could realistically detect the effect size.
This is where statistics becomes your best friend. Even without advanced tests, SEHS students use statistical thinking to discuss:
Reliability (consistency between trials)
Validity (whether you measured what you intended)
Random vs. systematic error
Whether changes are meaningful or just noise
If you struggle with outliers and how they can distort conclusions, the logic is explained clearly in Why do outliers matter so much in IB Math AI?. The same reasoning applies when a single unusually fast sprint time shifts your average.
Biomechanics and energy systems: math you can feel
The most satisfying overlap is when math stops being symbols and becomes something you can sense in your body.
In IB SEHS, biomechanics turns movement into measurable variables: levers, torque, force production, angles, and efficiency. You start to see why small technical changes can produce large performance differences.
Energy systems do something similar with physiology: work rate, intensity, duration, and recovery become quantitative. If you revise A.2.3 Energy Systems, notice how often the assessment depends on interpreting data and linking it to the right system.
This is also why pairing SEHS with math makes you harder to surprise in exams: you’re used to converting messy reality into a controlled explanation.
How to revise IB SEHS with a math-first strategy
Here’s a practical routine that plays to the strengths of IB SEHS while building exam marks:
The goal is simple: train your brain to treat numbers as evidence, not decoration.
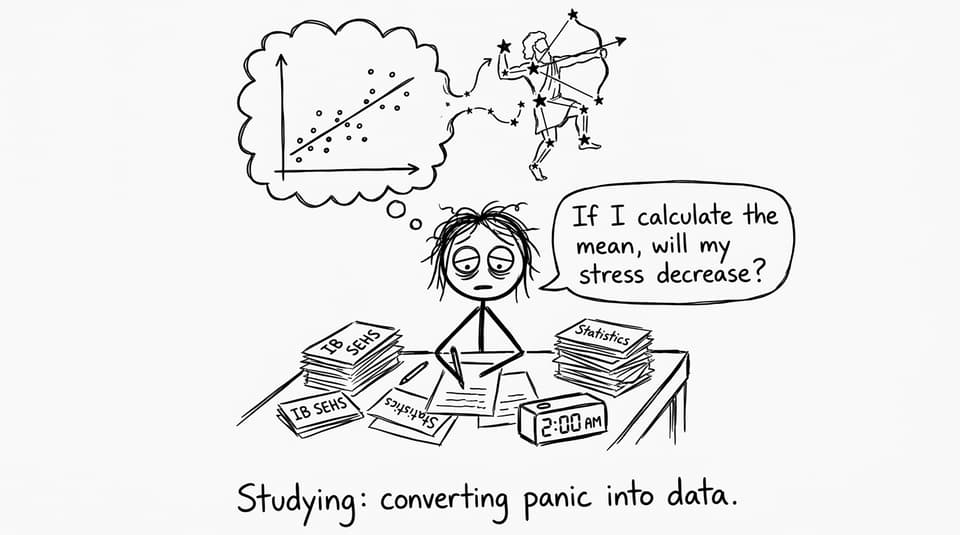
Studying: converting panic into data.
Conclusion: IB SEHS is where numbers become decisions
The real reason IB SEHS complements Math and Statistics is that it teaches you to respect uncertainty without freezing.
You collect imperfect data. You model it. You interpret it. You admit limitations. Then you decide what the evidence most likely means.
That’s not just exam technique. It’s a life skill.
If you want to turn that skill into marks, make RevisionDojo your basecamp: use Study Notes to learn cleanly, Flashcards to keep definitions sharp, the Questionbank to practise data-heavy questions, AI Chat when explanations don’t click, Grading tools for coursework feedback, Predicted Papers and Mock Exams for realism, the Coursework Library for exemplars, and Tutors when you want a human to tighten your approach. And as you revise, keep returning to the same idea: IB SEHS is math with a heartbeat.
IB SEHS goal setting in sport made simple: goal types, SMART targets, common mistakes, and exam-ready tips using RevisionDojo practice tools.