

The moment your IB model meets reality
There’s a quiet, familiar moment in the IB Math IA: your model finally produces an equation that looks impressive on the page. The graph is smooth. The parameters are neat. You can almost hear the “that’ll do.”
Then you test it.
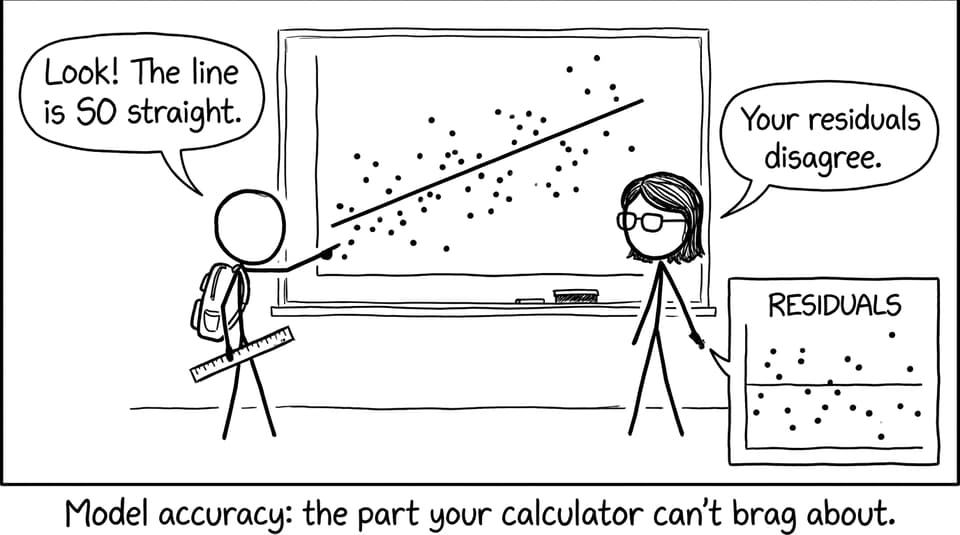
A couple of points miss the curve. Residuals clump. Predictions drift when you change the domain by a little. Suddenly, the most important question isn’t “Did I build a model?” It’s whether the model deserves trust.
In the IB, evaluating the accuracy of mathematical models is where your IA shifts from showing technique to showing judgment. Examiners reward students who can measure error, interpret what it means, and honestly describe where the mathematics holds, and where it doesn’t.
IB model accuracy checklist (use this before you write)
Use this quick checklist to evaluate accuracy in an IB-appropriate way:
-
Define what “accuracy” means for your investigation (fit, prediction, realism, or all three).
-
Compare observed vs predicted values using a table and at least one graph.
-
Compute at least one numerical measure (residuals, RMSE, percentage error, R²).
-
Diagnose error patterns (random noise vs systematic bias).
-
Check validity across a stated domain (and be cautious about extrapolation).
-
Compare an alternative model if it strengthens your argument.
-
Finish with a balanced claim: strong where it works, clear where it fails.
If you want examples of how strong evaluations are written, it helps to read models of good structure and tone, like Using IA/EE Exemplars to Improve Your IB Math IA.
Define “accuracy” like an IB examiner would
Accuracy sounds simple until you notice how many meanings it has in an IA.
In an IB modeling context, accuracy can mean:
-
Closeness of fit: how well the curve matches existing data.
-
Predictive accuracy: how well it predicts new or withheld data.
-
Context accuracy: whether outputs make sense in the real situation.
A strong IB evaluation starts with one sentence that pins down your definition. For example:
“In this IA, accuracy refers to how closely the model’s predicted values match measured data within the interval 0 ≤ x ≤ 12, using RMSE and residual plots.”
That sentence does two things IB examiners love: it sets a domain and it names the evidence you’ll use.
If you’re still shaping your evaluation section, you’ll find a clean structure in How to Write an IB Math IA Evaluation That Impresses Examiners.
Compare predicted vs observed values (make the gap visible)
Before metrics, show the comparison plainly.
Include:
-
A table with observed values, predicted values, and residuals.
-
A scatter plot of observed data with the model curve overlaid.
-
Optionally, an observed vs predicted plot (y vs ŷ) to show alignment.
In IB communication terms, this is where you earn credibility: labels, units, consistent rounding, and a short note about how predictions were generated (calculator regression, spreadsheet, or code).
For common modeling pitfalls that weaken this section, see How to Avoid Common Mistakes in IB Math IA Modeling.
Use quantitative measures that match your IB model
Residuals (your most honest evidence)
Residuals are the difference between observed and predicted values:
Residual = observed - predicted
A model can look “good” on a graph and still have a residual pattern that quietly proves it’s wrong. In the IB, residual analysis is often the clearest way to evaluate the accuracy of mathematical models.
If you’re using regression, this is essential reading: Why Residual Analysis Is More Important Than the Regression Equation.
RMSE (one number that summarizes typical error)
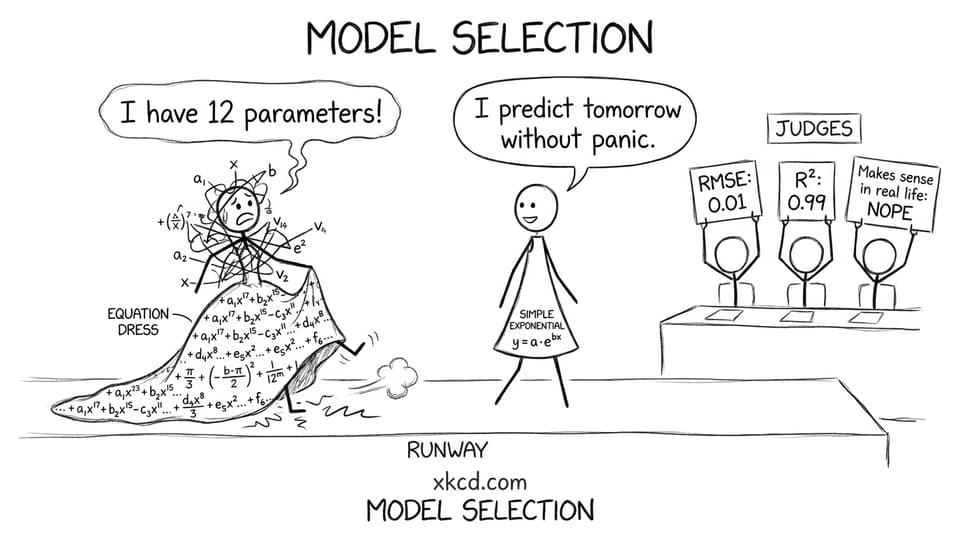
RMSE (root mean square error) compresses the overall error into one interpretable value in the same units as your data. In an IB IA, RMSE is especially useful when you want to compare two candidate models fairly.
R² (useful, but never alone)
R² tells you how much of the variation is explained by the model. But in IB evaluation, R² is supporting evidence, not the conclusion. A high R² can still hide curvature, outliers, or domain issues.
To connect these tools into a coherent evaluation paragraph, use a guide like How to Evaluate Model Fit Using Statistical Tools.
Interpret the numbers (this is where IB marks live)
IB examiners don’t reward a pile of statistics. They reward the thinking that follows.
After reporting your accuracy measures, translate them into meaning:
-
What does the RMSE imply relative to the scale of the data?
-
Are residuals randomly scattered around 0, or do they curve?
-
Do errors increase as x increases (suggesting your model weakens over time)?
A useful pattern for IB writing:
“The RMSE of 0.42 suggests typical error is small relative to the mean output (~8.1). However, the residual plot shows negative residuals clustering at high x-values, indicating systematic underestimation beyond x=10.”
That single “however” is often the difference between describing and evaluating.
This emphasis on explanation over perfect decimals is deeply IB: Why IB Prefers Explanation Over Numerical Accuracy.
Separate random error from systematic bias
If your evaluation can name the type of error, it becomes more than a score report.
-
Random error looks like scatter: residuals bounce around zero with no clear structure.
-
Systematic error looks like a pattern: residuals curve, trend, or cluster on one side.
In IB terms, systematic bias is where you can propose meaningful improvements: change model family, transform variables, collect more representative data, or restrict domain.
And don’t forget the less glamorous accuracy checks: units, rounding, consistent variable definitions, and calculator transcription errors. These small slips can damage model trust. A practical companion is How to Avoid Common Mathematical Errors in the IA.
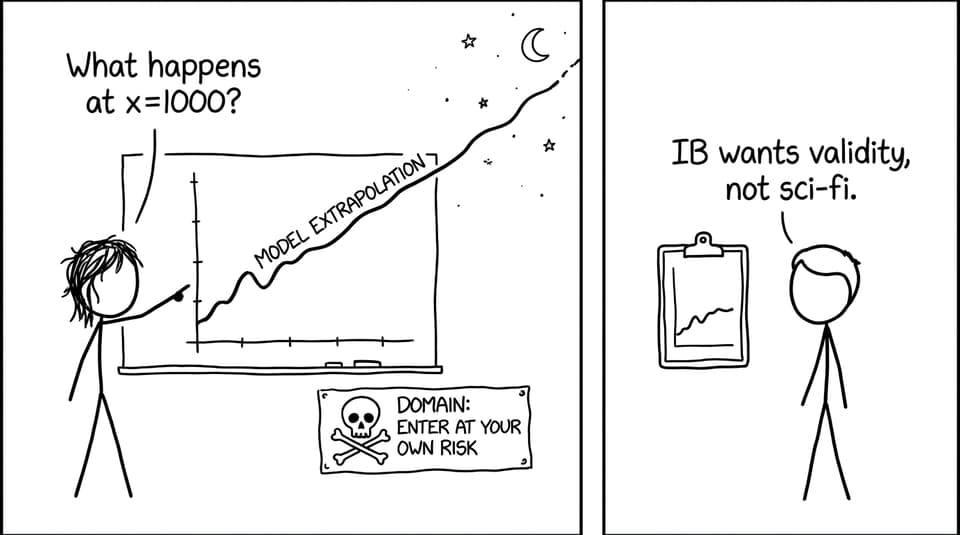
Check validity across domains (and be careful with extrapolation)
A model can be accurate in the measured interval and unreliable one step outside it. So state your validity range clearly.
Try this IB-friendly phrasing:
“The model is accurate for 0 ≤ x ≤ 12, where data was collected. Beyond this range, extrapolation becomes unreliable because residuals increase and the context assumptions no longer hold.”
If you’re working with non-linear regression, RevisionDojo’s topic notes can help you justify model choice and evaluation language: Non-linear Regression Notes (AI AHL 4.13).
Compare an alternative model (if it improves your evaluation)
An easy way to deepen an IB evaluation is to test one alternative model and explain the trade-off.
For example:
-
A polynomial might reduce RMSE but create unrealistic long-term behavior.
-
An exponential might fit early data but over-predict later.
-
A logistic model might match context constraints (carrying capacity) even if R² is similar.
The goal isn’t to “win” with the lowest error. The goal is to justify which model is most accurate for your purpose.
Closing: accuracy is the story your model tells about itself
In the IB, the strongest Math IAs don’t pretend models are perfect. They treat accuracy like a conversation with reality: you predict, you measure the gap, you explain why the gap exists, and you decide what that means.
If you want to evaluate the accuracy of mathematical models with examiner-level clarity, RevisionDojo is built for that workflow: practice the skills with the Questionbank, lock in methods with Study Notes and Flashcards, sanity-check interpretations with AI Chat, and refine drafts using Grading tools, Mock Exams, Predicted Papers, the Coursework Library, and Tutors.
For a strong next step, use IB IA Guides: Internal Assessment Structure, Rubrics & Tools to tighten your evaluation section and make your IB modeling claims feel precise, credible, and calm under pressure.