


Data interpretation is one of those IB skills that feels obvious right up until exam pressure makes a graph look like modern art.
You’ve seen it happen: a case study appears in Paper 2 or Paper 3, there’s a chart, a table, maybe a map, and your brain tries to sprint straight to a conclusion. Then the marks disappear in the gap between what you noticed and what you proved.
Great IB teachers don’t just teach content. They teach you how to think with evidence, how to read the story inside the numbers, keep your claims cautious, and connect to course concepts without guessing. This guide shows what that support looks like, and how you can copy the method in your own revision.
A quick IB checklist for accurate data and case study work
Use this as your 30-second warm-up before you write anything in IB data response:
-
Identify the visual type (graph, table, map, diagram, extract).
-
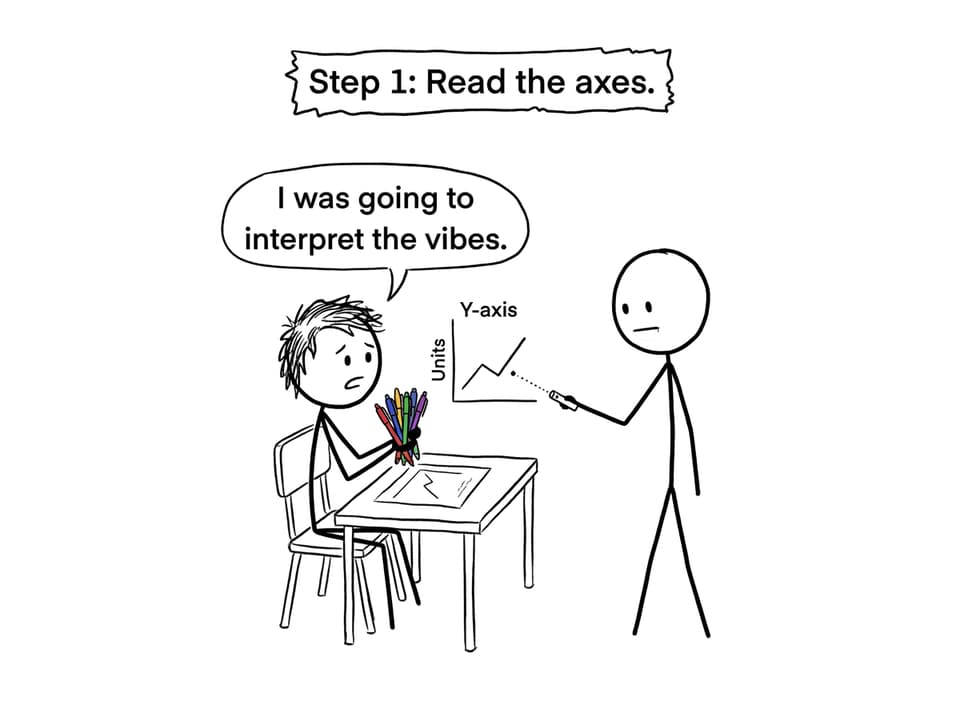
Read axes, units, scale, time period, and key.
-
Circle two main patterns and one anomaly/outlier.
-
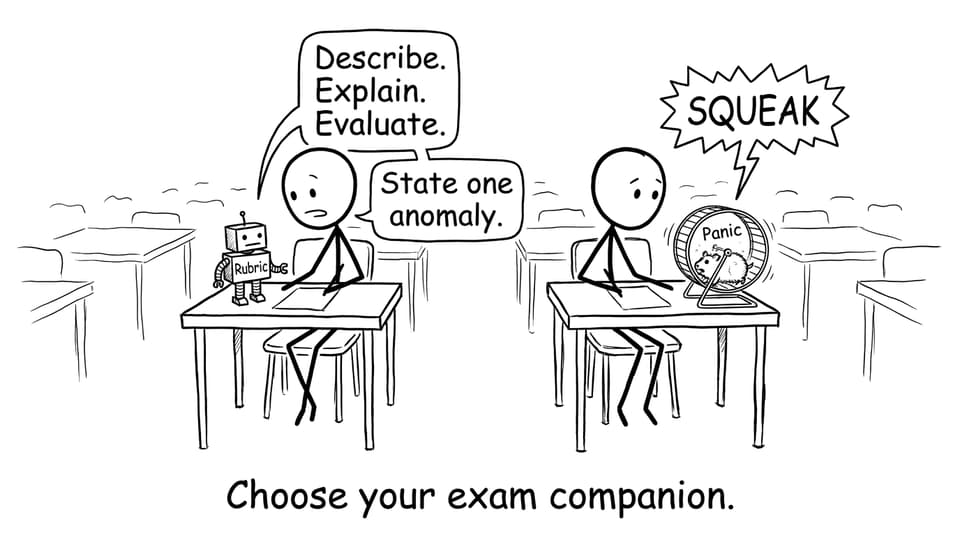
Match your response to the command term (describe vs explain vs evaluate).
-
Add context: what topic, concept, or model does this belong to?
-
Make one cautious claim with evidence: “This suggests… because…”.
-
State one limitation (sample size, bias, measurement, missing variables).
If you want structured practice in this style, your teacher may point you to RevisionDojo for Schools, where data-based questions and feedback can be organised by topic and skill.
Why accurate interpretation matters across IB subjects
The IB doesn’t reward you for simply spotting that “the line goes up.” It rewards you for showing judgement: selecting evidence, using precise language, and linking to the right idea.
That’s why the same skill keeps showing up in different clothing:
-
In Geography, you might interpret a hydrograph or choropleth and link it to processes.
-
In Economics, you might connect a shift on a diagram to a policy change and then evaluate consequences.
-
In Biology, you might interpret experimental results, comment on anomalies, and discuss reliability.
A strong IB interpretation is basically a mini-argument: claim, evidence, reasoning, and a modest level of doubt.
The teacher move that changes everything: separate description from analysis
Many IB students blend description and analysis into one paragraph, which usually becomes vague. Strong teachers train you to separate the gears:
-
Description is what is visible and measurable (trend, comparison, peak, minimum, correlation).
-
Analysis is why it might be happening (mechanism, theory, context, process).
-
Evaluation is what could weaken the conclusion (limitations, alternative explanations, reliability).
A good classroom routine is to highlight each sentence in a different colour: one for describe, one for explain, one for evaluate. After a few rounds, you start hearing the difference in your own writing.
Teach a repeatable IB framework: Describe, Explain, Evaluate
When teachers want your IB answers to become consistent under time pressure, they often give you a compact framework you can reuse.
Describe
Start with 2-3 precise sentences:
-
Use numbers where possible: “increases from X to Y,” “peaks at,” “is twice as high.”
-
Include comparisons: “higher than,” “lower than,” “widens after.”
-
Mention the anomaly: “except for,” “notable outlier at.”
Explain
Now connect to course ideas:
-
Name the concept or mechanism (not just a vibe).
-
Tie it to the context of the case study.
-
If you’re unsure, phrase it cautiously: “A possible explanation is…”
Evaluate
Finish with judgement:
-
What limits the claim?
-
What extra data would you want?
-
Is the source or method reliable?
This structure is especially helpful when you practise with exam-style prompts in RevisionDojo’s Questionbank and then review how your explanation and evaluation compare to high-scoring patterns.
Model “thinking aloud” so you can borrow the mental script
A quietly powerful thing an IB teacher can do is narrate their reasoning, step by step, in plain language.
It sounds like:
-
“Before I interpret, I’m checking axes and units.”
-
“I see a trend, but I’m also looking for the time period and what changed in the context.”
-
“I can’t claim causation from this alone, so I’ll say ‘suggests’ and name another variable.”
When you hear this often enough, you build an internal checklist that runs automatically. You can simulate it during revision by talking through one graph out loud, then writing the answer. It feels slow at first, but speed comes after correctness.
For extra topic-specific drills, you can mirror this approach using guides like How to Analyze IB Geography Data Effectively or the more statistics-heavy IB Math: Interpret Data in Math AI Using Technology.
Train visual literacy like it’s its own topic (because it is)
Most accuracy errors in IB data questions are not “hard concepts.” They’re rushed reading.
Strong teachers treat visual literacy as a separate skill and run short drills:
-
Axis scan drills: identify units, intervals, and whether scales are linear or not.
-
Legend discipline: read the key first, especially on maps and multi-line graphs.
-
Anomaly hunting: find the point that doesn’t fit, then ask why.
-
Sketch the trend: draw a simple trendline, then describe it in one sentence.
In your own prep, this pairs well with RevisionDojo Study Notes (to refresh the theory) and Flashcards (to keep key terms ready), so your brain can spend exam time interpreting, not remembering.
Case studies: the “story behind the data” routine
A case study in IB exams is rarely there just to test memory. It’s there to see whether you can apply a model to a real situation without overreaching.
Good teachers push three questions early:
-
What is the issue and who is affected?
-
What is the evidence (data, quotes, outcomes, constraints)?
-
Which concepts/models are most relevant, and which are a stretch?
A simple case study template many teachers use:
-
Context in one sentence (location, time, stakeholders).
-
Key evidence (2-3 bullet points with numbers if available).
-
Theory link (name the model or process).
-
Judgement (trade-offs, limits, alternative explanations).
To practise this efficiently, RevisionDojo’s AI Chat can quiz you Socratically (“What assumption are you making here?”), while Grading tools help you see whether your evaluation is actually evaluative or just a summary.
Comparative thinking: the fast route to higher-level answers
A common teacher strategy for stronger IB interpretation is to force comparison, because it creates meaning.
Try:
-
Compare two time periods: before vs after an intervention.
-
Compare two groups: region A vs region B.
-
Compare two measures: output vs per capita, short-run vs long-run.
Even one clean comparison sentence can turn a flat description into analysis: “Although both increase, X rises faster than Y after 2019, suggesting…”
If you’re revising Maths AI, you’ll see this judgement skill appear again when discussing precision and limitations; the Grouped vs Ungrouped Data guide is a good example of what cautious comparison looks like.
The classic IB pitfalls your teacher is trying to save you from
Teachers repeat these warnings because they cost marks every session:
-
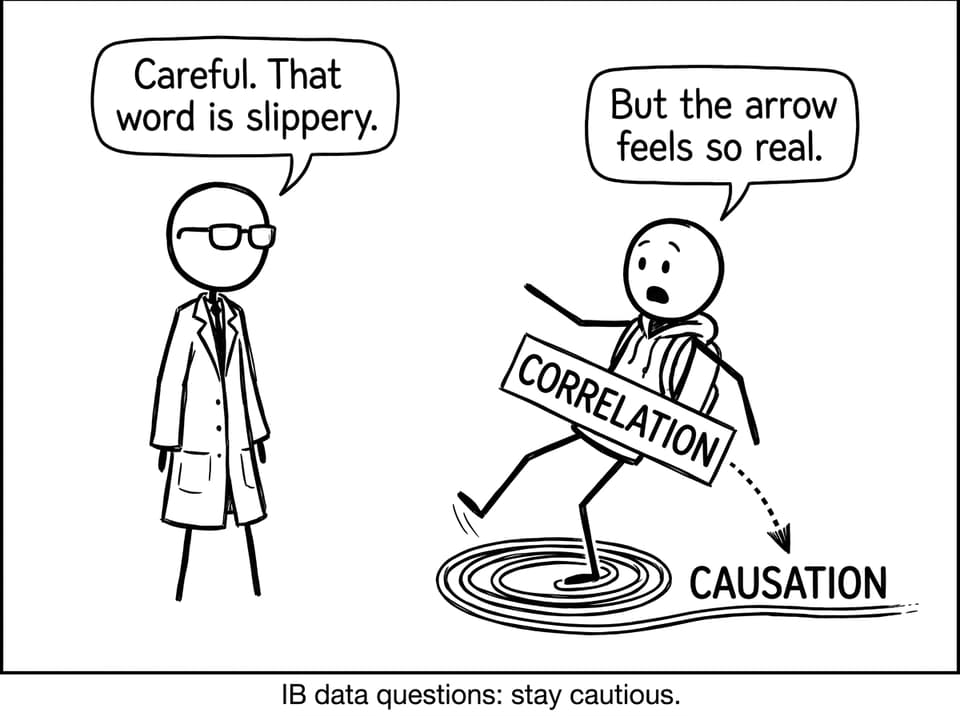
Correlation is not causation (unless the task and evidence justify it).
-
Ignoring units or scale (especially percentages vs raw values).
-
Overgeneralising from small or biased samples.
-
Forgetting anomalies (examiners love them).
-
Writing a narrative instead of an argument (no evidence, no reasoning).
RevisionDojo helps here because the Mock Exams and Predicted Papers style practice nudges you into exam pacing, while the Coursework Library can show you what “evidence-led writing” looks like in longer forms.
FAQ
How can my IB teacher help me stop describing and start analysing?
Your IB teacher can make the gap visible by marking description and analysis as different categories, not just “good” or “weak.” In class, they might model a perfect description that earns only a few marks, then show how one extra “because” sentence (linked to theory) doubles the value. They can also require you to write in a fixed structure like Describe, Explain, Evaluate until it becomes automatic. Another powerful move is to give you two sample answers that use the same data and ask which one is more analytical and why. Over time, you learn that analysis is not longer writing, it is tighter reasoning. If you want more independent reps, use RevisionDojo’s Questionbank and compare your explanations to rubric-aligned patterns.
What should I do when a case study feels unfamiliar in an IB exam?
First, remember that unfamiliarity is part of the IB design: it tests transfer, not recall. Your teacher can train you to anchor on what is certain in the extract: variables, stakeholders, time period, and constraints. Next, you look for which topic the case study is secretly testing and choose one or two relevant concepts rather than dumping everything you know. Then you make cautious claims using evidence language: “This suggests,” “This may be due to,” “One possible factor is.” Finally, you protect marks by adding a limitation, like missing variables or potential bias in the source. Practising this with timed prompts on RevisionDojo, then using AI Chat to challenge your assumptions, is a fast way to build calm under uncertainty.
How do I improve accuracy when interpreting graphs and tables under time pressure?
Accuracy in IB data interpretation comes from routines that are boring in practice and lifesaving in exams. Ask your teacher to enforce a mandatory “visual scan” before writing: axes, units, scale, and key. Then train yourself to identify two trends and one anomaly every time, even if the question does not explicitly ask for it. Another teacher-led technique is to have you write one sentence per mark, so you stop padding and start selecting evidence. You also get faster when you practise with mixed visuals, not only the type you prefer. RevisionDojo supports this kind of practice because you can cycle quickly through varied question formats, use Flashcards for key terminology, and check explanations with rubric-focused feedback.
Conclusion: borrow your teacher’s method, then practise it until it’s yours
The students who score well on IB data and case study questions are rarely “math people” or “fast readers.” They’re people with a method: they scan the visual, separate description from analysis, connect to context, and evaluate with caution.
Your IB teachers can give you that method in class. RevisionDojo helps you keep it in motion at home with the Questionbank, Study Notes, Flashcards, AI Chat, Grading tools, Predicted Papers, Mock Exams, the Coursework Library, and access to Tutors when you want targeted feedback. Take one dataset tonight, run Describe, Explain, Evaluate, and make accuracy your habit before it has to be your performance.