



IB Math: why this comparison suddenly feels unsafe
You can do ten questions in a row where everything is clean and exact, and then IB Math hands you a table of class intervals and asks you to compare it to a list of raw values.
And it feels unfair in a very specific way.
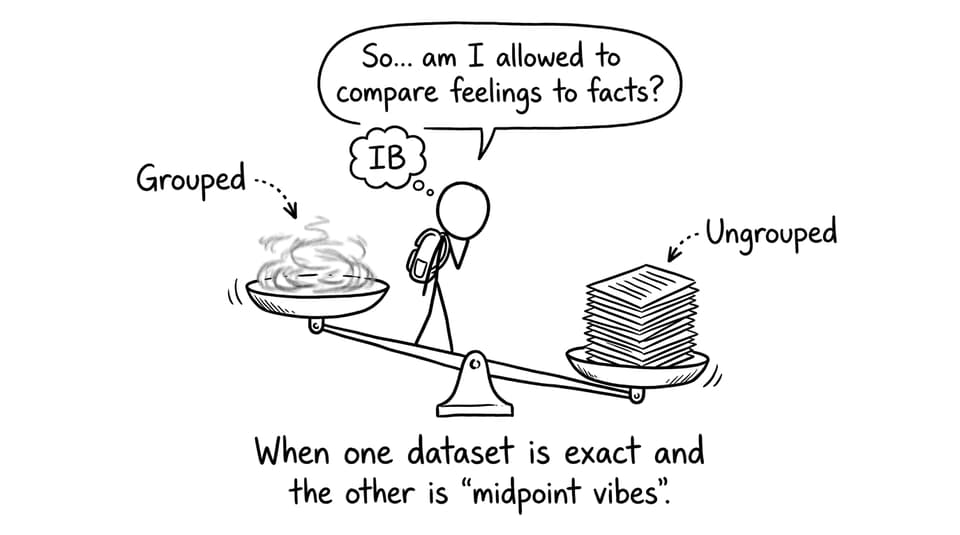
Not because you forgot the formula. Not because your calculator can’t handle it. But because the moment you compare grouped and ungrouped data, you’re no longer comparing two numbers of the same “type.” One is a photograph. The other is a sketch made from memory.
That sense of uncertainty is the point. In IB Math, comparing grouped and ungrouped data is really a test of how you think about precision, estimation, and limitations.
Quick checklist before you compare grouped and ungrouped data
Keep this short checklist in your head whenever IB Math asks for a comparison:
-
Identify which dataset is grouped (intervals + frequencies) and which is ungrouped (exact values).
-
Label any statistic from grouped data as an estimate.
-
Compare general trends, not exact differences.
-
Use cautious language: “suggests,” “likely,” “may be due to grouping.”
-
Mention what grouping hides: the distribution inside each class.
If you do only these five things, you protect a surprising number of interpretation marks.
What actually changes when data becomes grouped
Ungrouped data gives you the individual values. You can compute the mean, median, quartiles, IQR, standard deviation, and you can justify each one with confidence.
Grouped data is different. In IB Math, grouped data typically appears as a frequency table or histogram classes, where the original values are hidden inside intervals.
So when you calculate a grouped mean, you usually replace each interval with its midpoint, then run the mean calculation from there. That midpoint step is the hidden trade-off: it makes the problem doable, but it quietly introduces an assumption about where values sit inside each class.
If you want a solid refresher on the mechanics and the examiner-friendly wording, the RevisionDojo notes for Mean of Grouped Data, Standard Deviation, Quartiles, IQR are built exactly for these moments.
Why the comparison feels tricky (and why IB keeps asking it)
The “trickiness” comes from mixed certainty:
-
The ungrouped mean is based on exact values.
-
The grouped mean is an estimate based on midpoints.
So if the grouped mean is higher, what are you allowed to say?
In IB Math, you’re allowed to compare, but you’re expected to admit the uncertainty. The difference between two means might reflect a real difference between the groups, or it might be a side effect of how the classes were chosen.
RevisionDojo breaks this idea down clearly in Why Are Means from Grouped Data Only Estimates in IB Statistics? and the companion piece Why Does Grouped Data Lose Information in IB Statistics?. Together, they explain the examiner logic: a precise calculation can still produce an imprecise conclusion.
The most common mark-losing move: over-comparing the numbers
A very human response is to treat the outputs like they’re equally trustworthy.
Example of what loses marks:
- “Group A has a mean of 62.4 and Group B has a mean of 61.8, therefore Group A is higher.”
The examiner hears: you ignored that one (or both) of those values might be an estimate.
What earns marks in IB Math is the same comparison, written with judgement:
- “The grouped mean suggests a slightly higher average, but the difference may be due to estimation from class midpoints.”
That one sentence signals that you understand what grouped data does to precision.
To practice this in exam style, use RevisionDojo’s Statistics & Probability topic hub and the SL 4.3 Questionbank, then check your wording with AI Chat to make it sound like a markscheme.
How to write comparisons the way examiners reward
In IB Math, the best comparisons do three things:
State what is solid vs estimated
Say plainly: “The grouped statistics are estimates.” Then continue.
Compare shapes and spread, not just means
If you have box plots, medians, IQRs, or histograms, talk about spread and skewness. RevisionDojo’s article Why Do Box Plots Reveal More Than Averages in IB Statistics? is a good reminder that “same mean” does not mean “same story.”
Mention what could change the conclusion
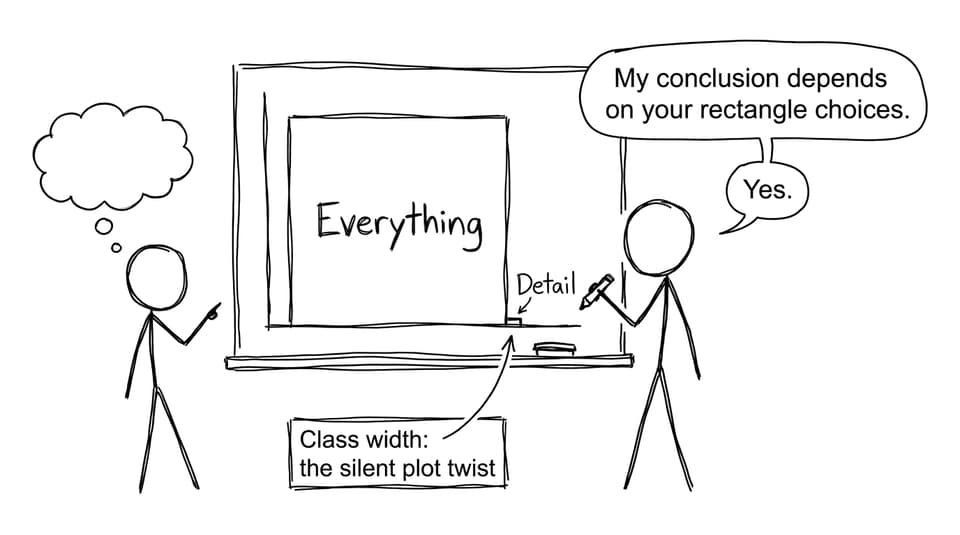
Grouping choice matters. Class widths can hide clusters or exaggerate trends. If you want a quick sense of how dramatic that effect can be, see Why Does Choosing the Wrong Class Width Distort Histograms in IB Maths?.
A final way to think about it (and what to do next)
Comparing grouped and ungrouped data feels tricky in IB Math because you’re comparing certainty to approximation. The maths is straightforward. The judgement is the real exam.
If you want this skill to feel automatic, build a small routine: review the notes, do ten targeted questions, and use AI Chat to polish your interpretation lines. RevisionDojo ties it together with Study Notes, Flashcards, a syllabus-aligned Questionbank, and examiner-style Grading tools so you stop fearing these comparisons and start collecting the easy interpretation marks.