
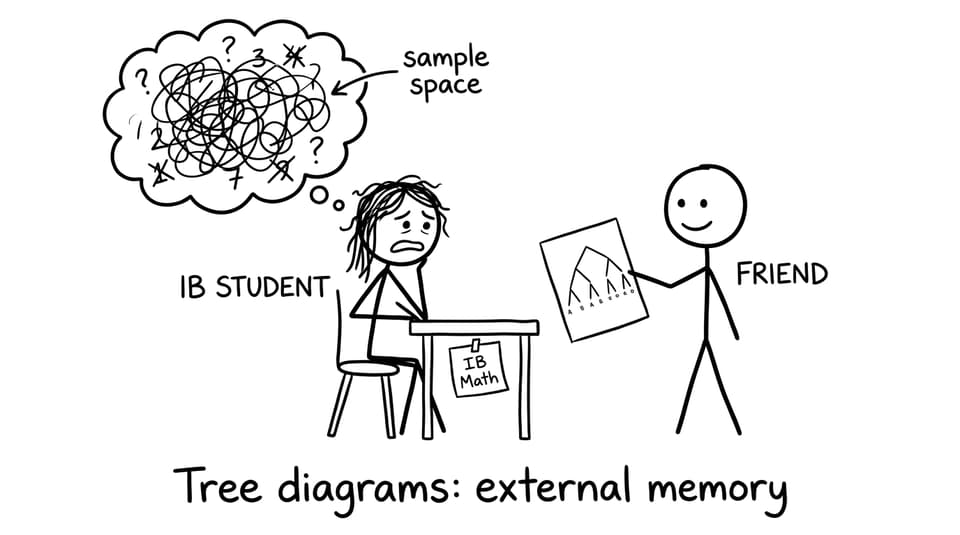
If you have ever walked out of an IB Math exam thinking, “I knew the topic… so why did my answer drift?” you are not alone. Probability is the perfect place for small slips to hide: one missing outcome, one unadjusted denominator, one “and vs or” mix-up, and the whole solution quietly collapses.
That is why tree diagrams matter in IB Math. They are not decorative. They are a mistake-prevention system that turns hidden steps into visible ones.
A quick checklist for cleaner IB Math probability
When you draw a tree diagram, you are forcing three exam-saving habits:
-
List the sample space step-by-step (no missing outcomes).
-
Update probabilities after conditions (no denominator errors).
-
Separate “multiply” from “add” visually (no AND/OR confusion).
If you want a structured refresher before drilling questions, start with IB Math AI: Statistics and Probability and then jump into targeted practice.
Tree diagrams make the sample space impossible to ignore
Most probability errors in IB Math are not “hard maths” errors. They are accounting errors. Students accidentally double-count a path, forget a path, or treat two different situations as if they were the same.
A tree diagram acts like a receipt: it shows every outcome you are claiming exists. When the question has multiple stages (draw 1 then draw 2, test result then diagnosis, win then final), the diagram builds the sample space in the same order the story happens.
For quick concept support, RevisionDojo’s notes on combined and conditional ideas are especially helpful: SL 4.6 Probability diagrams and conditional ideas.
Tree diagrams reduce conditional probability mistakes (the denominator trap)
Conditional probability in IB Math often breaks students for one reason: the denominator changes, but their brain keeps using the original total.
A tree diagram makes conditioning physical. Once you move down a branch, you have implicitly said, “Given that this happened.” The sample space has narrowed, and the second-stage probabilities must reflect that new reality (especially in without-replacement questions).
If conditional probability has ever felt oddly counterintuitive, this explanation pairs well with diagram practice: Why conditional probability feels so counterintuitive.
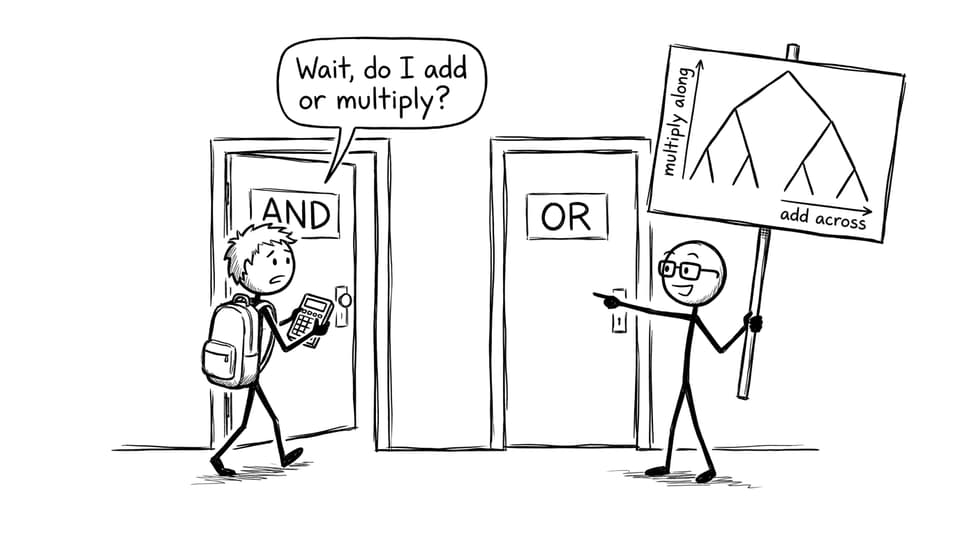
Tree diagrams separate multiplication vs addition (AND vs OR)
There is a reason examiners see the same mistake repeatedly: students add along a path or multiply across paths. Under time pressure, the words “and” and “or” blur.
Tree diagrams fix this with layout:
-
Along one path you are building a sequence, so you multiply.
-
Across different paths you are combining mutually exclusive ways, so you add.
That visual separation is a small thing that saves a lot of marks in IB Math.
Tree diagrams reveal independence vs dependence instantly
Independence is not a vibe, it is a claim. And in IB Math, false independence assumptions wreck answers.
In a tree diagram:
-
If the second-stage probabilities change after the first event, dependence becomes obvious.
-
If they stay the same, independence is reinforced (and easier to justify).
For a clear definition-and-examples run-through, see Independent events and conditional probability notes.
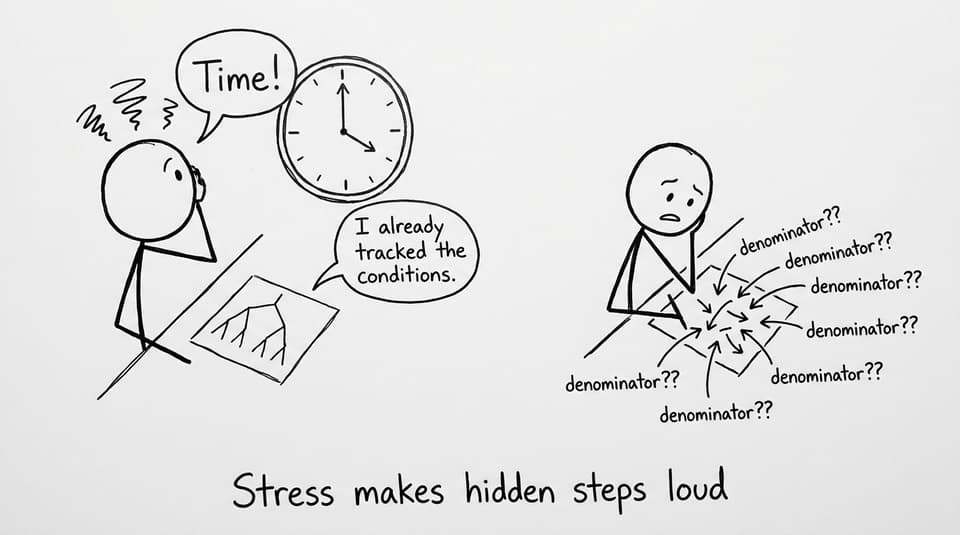
Under exam stress, tree diagrams become “external working memory”
Exams do not just test knowledge. They test whether you can keep multiple conditions alive while also writing clean logic. Tree diagrams reduce cognitive load by storing the conditions on paper, so your attention can focus on the next step.
That is why tree diagrams often feel “slower” during practice, yet faster during real exams: you spend less time re-reading, restarting, and second-guessing.
Practice tree diagrams the RevisionDojo way
In IB Math, tree diagrams become reliable only when you use them repeatedly across question types. A good loop looks like this:
-
Review key rules in Statistics & Probability for IB Math AA
-
Drill sequential/conditional questions in the SL 4.11 Questionbank
-
Use Flashcards for Statistics & Probability to lock in vocabulary and triggers (“without replacement” == probabilities change)
Then tighten the loop with RevisionDojo’s AI Chat when you are stuck, and use Grading tools to learn what earns method marks when your final number is off.
Conclusion: Tree diagrams are not extra work, they are error control
In IB Math, most probability marks are lost to invisible mistakes: missing outcomes, wrong conditioning, and confused operations. Tree diagrams reduce those errors because they turn your thinking into a map you can check.
If you want to make that map automatic, build a short daily loop with RevisionDojo: Study Notes for clarity, Flashcards for triggers, Questionbank for repetition, AI Chat for stuck moments, and Mock Exams plus Predicted Papers for pressure training. Probability becomes calmer when your method is visible. And tree diagrams are the simplest way to make it visible.

