


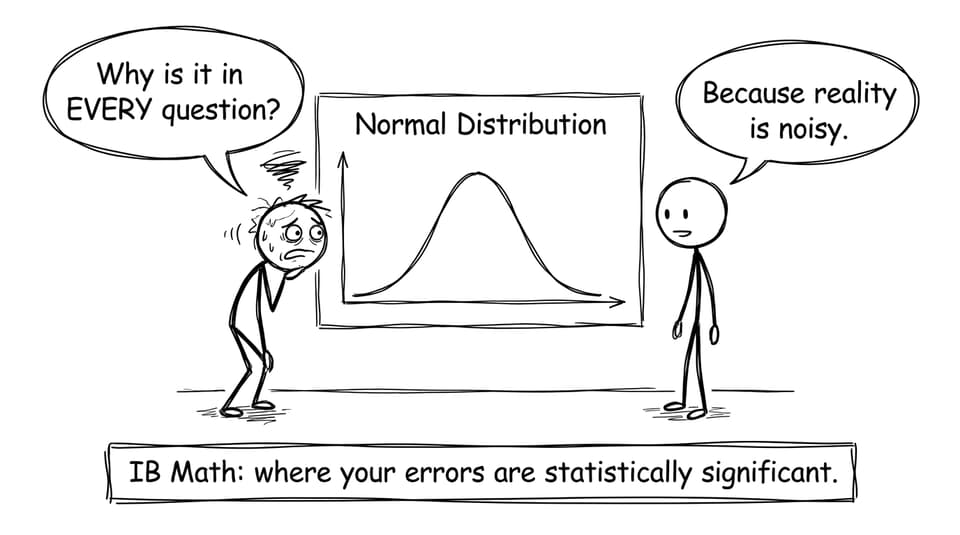
When you’re deep into IB Math, there’s a moment that feels oddly personal: you open yet another exam-style question, and there it is again: the bell curve. Same shape. Same symbols. Same quiet threat that you’ll shade the wrong region.
It can feel like repetition. But the normal distribution shows up so often for a reason: it’s one of the cleanest ways to test how you think about data, uncertainty, and interpretation, not just how fast you can calculate.
A quick checklist for normal distribution questions in IB Math
Before you calculate anything in IB Math, run this quick mental checklist:
-
What are the parameters (mean (\mu) and standard deviation (\sigma))?
-
What does the context mean in plain language (heights, scores, errors)?
-
Is the question asking for a probability, a percentile, or a value?
-
Do you need standardisation (a z-score) to compare fairly?
-
Did you sketch or at least visualise the shaded region?
If you want structured practice, the SL 4.9 Normal distribution topic page keeps the whole workflow in one place.
Why IB Math keeps returning to the bell curve
The normal distribution is everywhere in IB Math because it matches how many real processes behave: lots of outcomes cluster near an average, and extreme outcomes are rarer. That simple “most values are typical, few are wild” story is the backbone of modelling.
In practice, IB loves it because it’s a single framework that can test multiple skills at once: mean and standard deviation, probability, percentiles, calculator functions, and written interpretation. One diagram can assess half a chapter.
For the syllabus-aligned foundations, RevisionDojo’s Normal distribution notes are a solid refresher when your intuition feels shaky.
Natural variation: the hidden plot of IB Math statistics
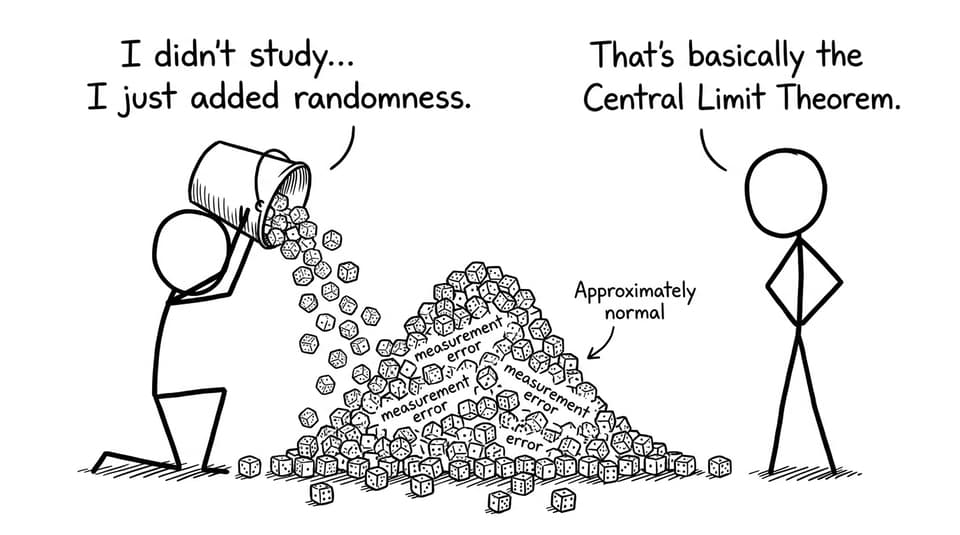
Think about heights, reaction times, measurement error, or repeated test scores. You don’t get one neat value, you get a spread. IB Math uses the normal distribution because it models that spread well enough to make meaningful predictions.
This is also why exam questions often sound “real.” The examiners want you to treat the normal distribution like a model of noise around a signal. The trick is remembering: the model isn’t reality, it’s a decision.
Standardisation: why z-scores make IB Math feel universal
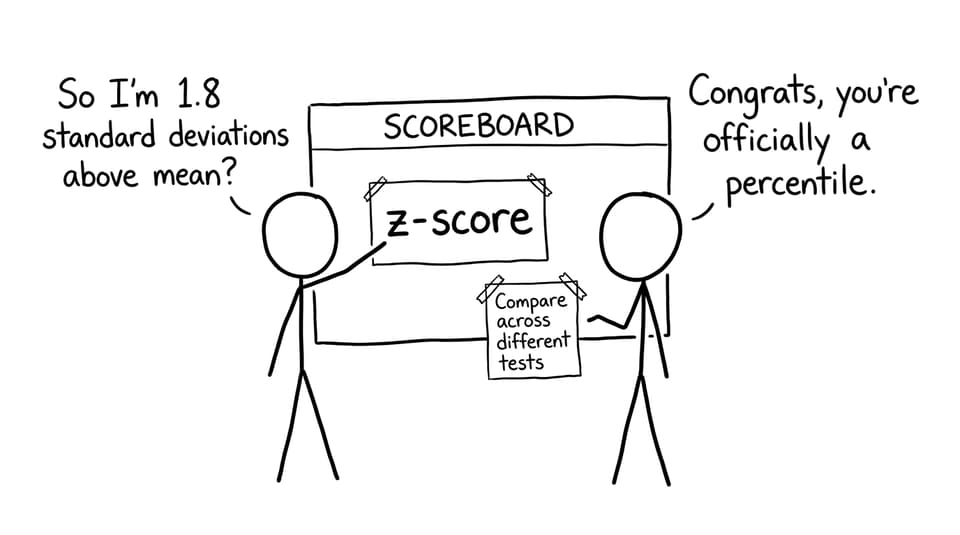
A major reason the normal distribution dominates IB Math is that it teaches fair comparison. A z-score tells you position relative to a distribution: how many standard deviations above or below the mean a value sits.
That’s powerful because it lets you compare different tests, different populations, or different units using one shared scale. If you want extra support with this step, the z-values and inverse normal notes help clarify what’s being calculated and what’s being concluded.
Interpretation over calculation: where marks actually live
Many students train IB Math normal distribution questions like a procedure: plug into calculator, copy probability, move on. But IB often allocates more marks to explaining what your probability means.
That’s why posts like Why IB questions care more about interpretation than z-score calculation matter: you’re being assessed on judgement. The bell curve is the stage; your explanation is the performance.
To tighten your instincts on visual reasoning, Why symmetry matters in normal distribution questions is also worth reading; symmetry is a shortcut and a safety check.
Bringing it home: make the normal distribution work for you
The normal distribution isn’t everywhere in IB Math because the IB ran out of ideas. It’s everywhere because it compresses a full philosophy of data into one picture: most outcomes are typical, uncertainty is normal, and interpretation is the point.
If you want that philosophy to turn into marks, RevisionDojo makes the process simple: drill exam-style questions in the Questionbank, tighten concepts with Study Notes and Flashcards, ask “why” using AI Chat, and check your explanations with Grading tools. Add Mock Exams, Predicted Papers, the Coursework Library, and on-demand Tutors, and you get a system that trains the exact kind of thinking the normal distribution was designed to reveal.
When the bell curve shows up again, you’ll recognise it for what it is: a familiar map, not a fresh obstacle, and a reliable way to score in IB Math.


