

The trap: when a perfect-looking r makes you relax
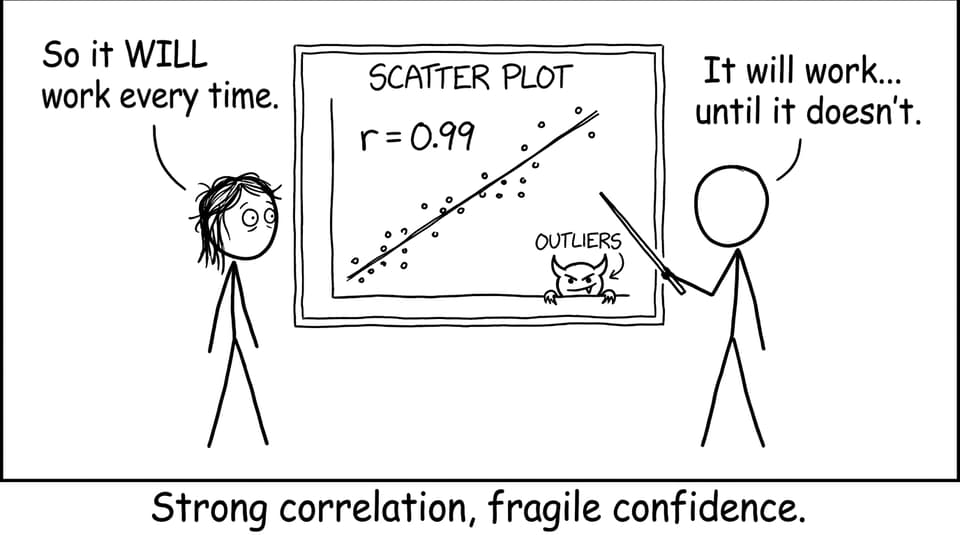
The night before an exam, you finally get a clean scatter plot. Your calculator spits out r = 0.98 and the regression line looks like it was drawn by a machine. In IB Math, that moment can feel like relief: “Great, we can predict.”
But it’s exactly the moment the syllabus is trying to train you to distrust. In IB Math, strong correlation is a clue, not a guarantee. Examiners want you to separate “these variables move together in this dataset” from “this model will predict well in the real world.”
Quick checklist: what to say after you calculate correlation
When an IB Math question asks you to comment on prediction quality, run this quick mental checklist before you write your conclusion:
-
Is the prediction interpolation (inside the data range) or extrapolation (outside it)?
-
Could there be hidden variables driving both x and y?
-
Does the scatter look roughly linear, or is a curve hiding inside a strong r?
-
Are there outliers or influential points pulling the regression line?
-
Has the context changed (time, location, conditions)?
For practice that mirrors how these prompts are actually worded, use RevisionDojo’s SL 4.4 Correlation Questionbank and the broader Statistics and Probability Questionbank.
Why strong correlation is not the same as strong prediction
In IB Math, correlation measures strength and direction of association in the observed data. That’s it. It doesn’t measure whether your regression line will stay reliable when you:
-
move beyond the observed range,
-
apply it in a new setting,
-
or face a different mix of underlying causes.
That’s why IB rewards language like “suggests,” “may indicate,” and “within the range of the data,” especially when you justify the limitation.
If you want a deeper refresher on the wording IB expects, see Why Does Correlation Not Mean Causation in IB Maths?.
Hidden variables: the puppet-master problem
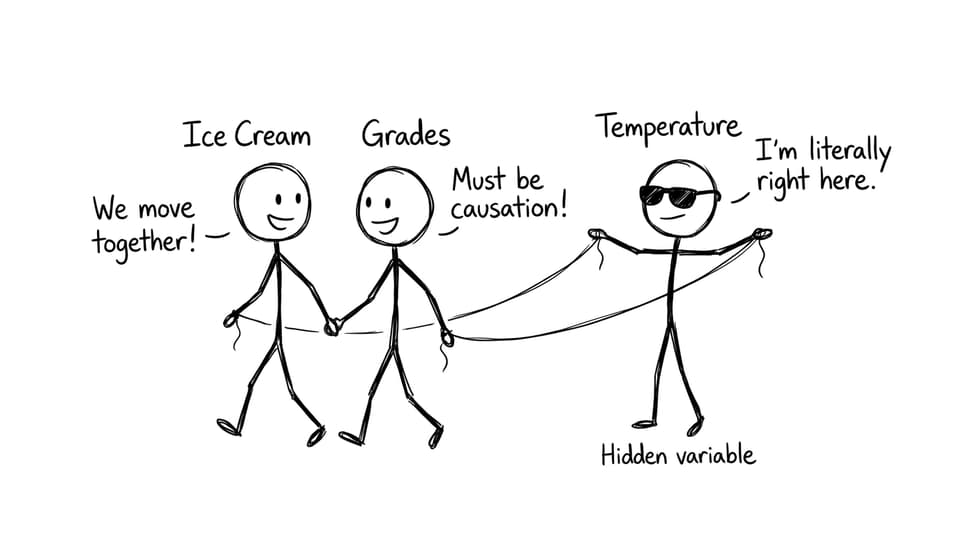
A strong correlation can happen because both variables respond to a third factor. This is one of the most common “gotchas” in IB Math explanation marks.
Example idea: imagine x and y rise together, not because x causes y, but because a third variable nudges both upward. If that third variable changes in a new scenario, your prediction collapses even though r looked impressive.
RevisionDojo’s SL 4.4 notes on scatter diagrams and Pearson’s r are a good place to tighten this concept with proper IB Math vocabulary.
Non-linearity and residuals: the part your calculator doesn’t warn you about
Another reason strong correlation can still predict poorly: the relationship may only look linear over a narrow window. Within that window, r can be high. Outside it, the pattern bends.
This is why IB likes residual thinking. Residuals tell you whether the linear model is systematically wrong (curving patterns, clusters) even when r looks strong.
For an exam-focused explanation, read Why Residual Analysis Is More Important Than the Regression Equation. In IB Math, that single insight often separates full marks from “method only.”
Extrapolation: where confidence goes to disappear
Even with strong correlation, predictions near (or beyond) the edge of the data range are weaker because there’s less supporting evidence. The regression line is being asked to speak about territory it hasn’t seen.
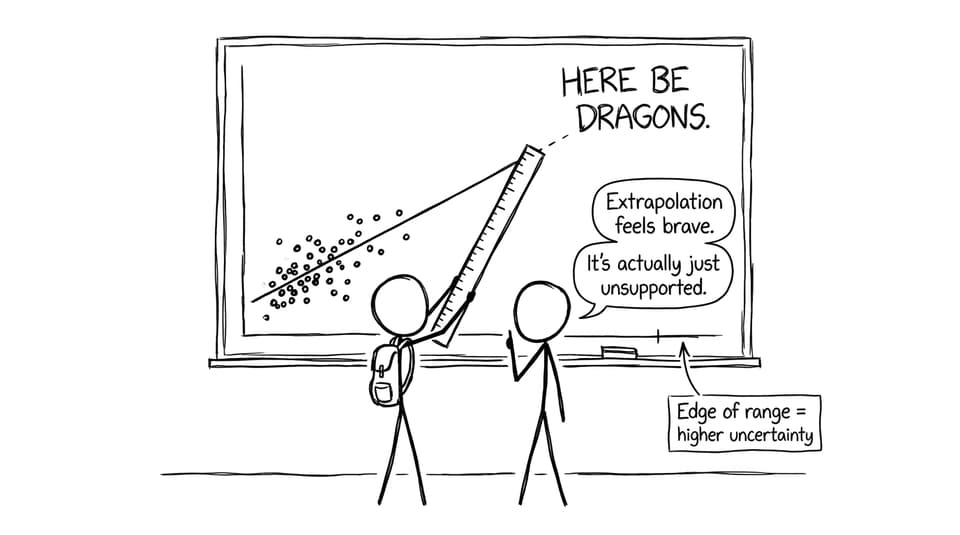
If your question involves predicting outside the given interval, anchor your answer with cautious phrasing and the reason: “outside the range, so reliability is reduced.” RevisionDojo explains this clearly in Why Extrapolation in Regression Carries Extra Risk.
Closing: the IB Math mindset shift
Strong correlation is useful. It’s just not permission to stop thinking. In IB Math, the highest marks go to students who treat regression like a model with boundaries: range limits, context limits, and evidence limits.
If you want that mindset to feel natural before exams, build it into your routine with RevisionDojo’s Questionbank, Study Notes, Flashcards, AI Chat, Grading tools, Predicted Papers, Mock Exams, Coursework Library, and Tutors. Strong correlation can start the story, but your evaluation finishes it -- and that’s where the marks live.