

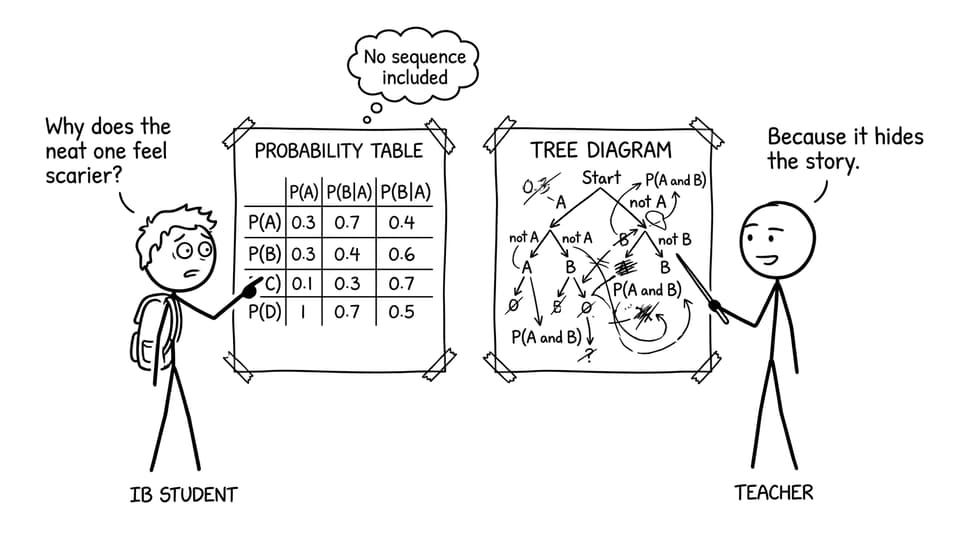
The moment a table turns “easy marks” into panic
In IB Math, probability can feel strangely emotional. You read the question, you understand the story, and then the exam hits you with a probability table: a calm grid of rows and columns that somehow makes your brain forget what “given that” means.
Tree diagrams don’t usually do this. They feel like a narrated walk through the situation. A table feels like the ending credits with the plot removed.
That difference matters in exam conditions. In IB Math, probability tables often feel harder not because the content is more advanced, but because tables hide the process that tree diagrams naturally reveal.
Quick checklist: how to make probability tables feel simpler
Use this mini routine any time IB Math throws a table at you:
-
Label what each row and column means in plain English.
-
Circle the intersection you actually need (this is usually the “and” event).
-
For conditional probability, physically restrict the sample space to one row/column.
-
Check whether you’re reading a joint probability or a marginal total.
-
Write one sentence of interpretation before calculating.
If you want structured practice for this, RevisionDojo’s Questionbank is built for quick sets that train table-reading under time pressure.
Why probability tables feel harder than tree diagrams in IB Math
Tables make you organise information before you understand it
A tree diagram grows one branch at a time, so your thinking stays aligned with the story. A probability table in IB Math is compact, but it’s compact in the way a suitcase is compact: everything is inside, and you have to unpack it to find what matters.
That “unpack first, understand second” order increases cognitive load. Under pressure, your brain spends effort reconstructing the process that created the grid instead of solving the question.
If tree diagrams are your comfort zone, RevisionDojo’s guide on how to use probability trees step-by-step is a solid way to keep the underlying story clear.
Tables hide sequence (and sequence is where marks are won)
Many IB Math probability questions are staged: first something happens, then something else happens, and the second stage might depend on the first.
Tree diagrams show this dependency through branching. Tables flatten it. So you’re left asking: “Is this probability already conditioned?” or “Is this before the second event?”
When you revise sequence-heavy problems, pair tables with trees by topic. You can reinforce this using RevisionDojo’s Statistics and Probability hub for IB Math AI and then drilling questions right after.
Joint probabilities are visually non-intuitive in a grid
In IB Math, the intersection of a row and column represents an “and” event. But under exam stress, a grid doesn’t feel like “and.” It feels like “a square that might be important.”
So students do predictable things: they add marginal totals, they read the wrong edge, or they forget that the intersection is the event that satisfies both conditions.
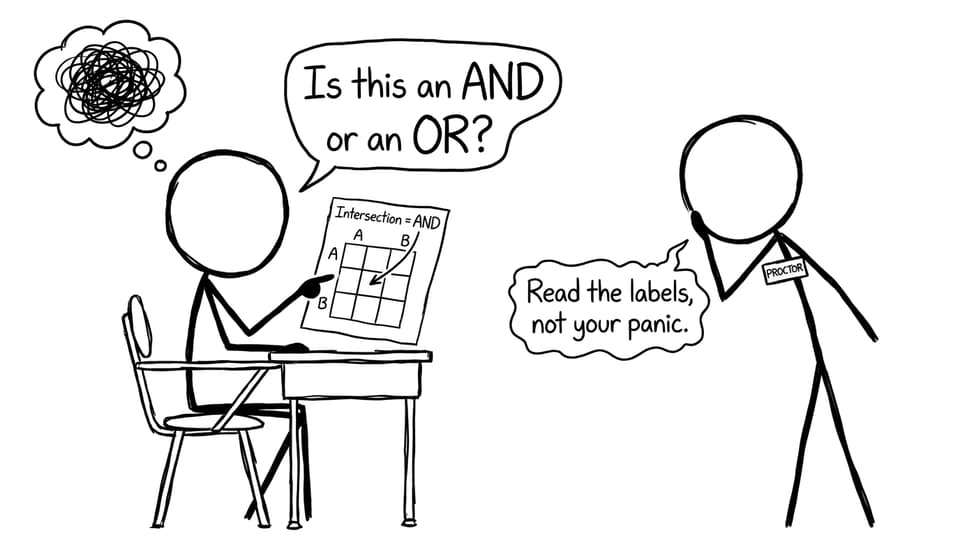
To build accuracy, practice questions that force you to name intersections explicitly. This pairs well with RevisionDojo’s step-by-step probability problem approach.
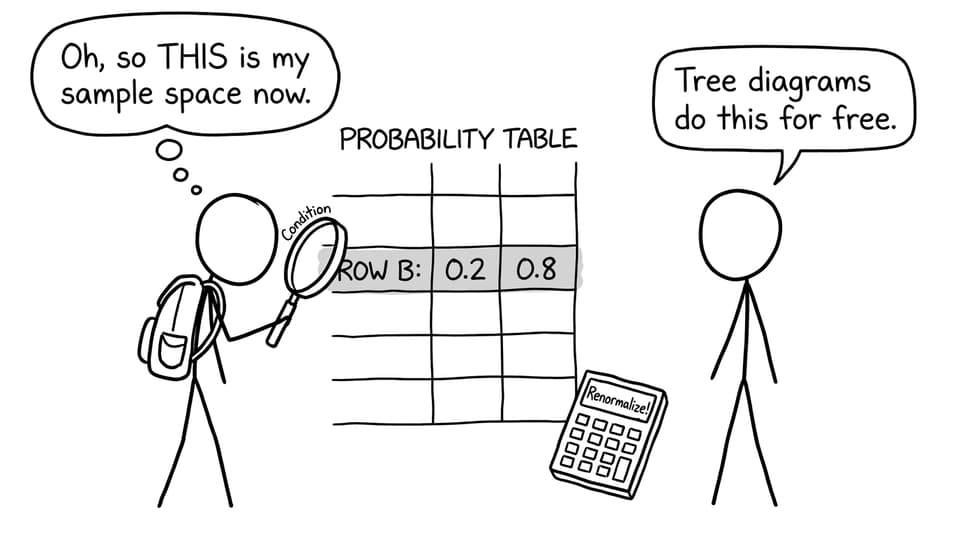
Conditional probability is harder because the “new sample space” is invisible
Conditional probability is where tables punish rushing. In a tree diagram, once you follow a branch, you can see that the sample space has changed.
In a table, that change is something you must impose yourself: restrict to a row or column, then renormalize.
That’s why denominator errors are so common in IB Math. Students know the formula, but they don’t update the universe.
If conditional probability still feels slippery, RevisionDojo’s explanation of why conditional probability feels counterintuitive is worth reading slowly.
The RevisionDojo way to practise tables (without losing confidence)
In IB Math, tables reward calm labeling and disciplined reading. RevisionDojo helps you build that calm with:
-
Study Notes that explain what each region of a table represents
-
Flashcards for conditional/joint/marginal probability language
-
AI Chat to check whether your chosen denominator matches your condition
-
Grading tools that push you to write method steps (not just answers)
-
Mock Exams and Predicted Papers so table questions stop feeling “random”
-
A Coursework Library and Tutors for targeted help if probability is a recurring weak spot
For extra reinforcement, you can also compare table thinking to tree thinking using why tree diagrams reduce errors and why probability tables feel harder than tree diagrams.
Conclusion: make the table tell a story again
Probability tables in IB Math feel harder because they’re quiet. They don’t narrate sequence, they don’t highlight conditions, and they don’t warn you when your sample space has changed.
But once you force the story back into the grid through labeling, circling intersections, and conditioning deliberately, tables become reliable instead of intimidating.
If you want that reliability before exams, use RevisionDojo’s Study Notes and Questionbank to train the skill until it’s boring (the best kind of exam confidence).