



The bell curve lie you were quietly sold
In IB Math, the normal distribution can feel like a promise: if you measure something “real,” it will eventually settle into a clean, symmetric bell curve. It’s a comforting idea. Symmetry feels fair. Smoothness feels scientific.
Then you collect actual data. The histogram leans. A tail drags. One weird value pokes out like a thumbtack. And suddenly you’re thinking, Did I do something wrong?
Here’s the truth that earns interpretation marks in IB Math: the normal distribution is a model, not a rule. Reality doesn’t owe you symmetry. It only occasionally approximates it.
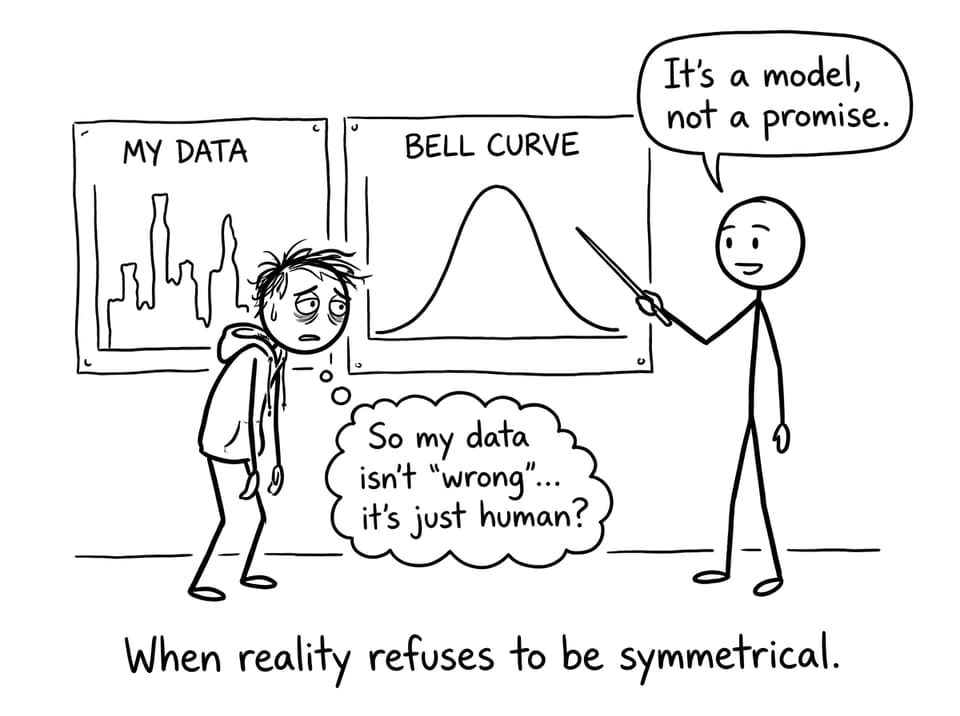
Quick checklist: why real data misses “perfect normal”
When your IB Math question hints “assume normality” or “approximately normal,” these are the usual suspects:
-
Natural boundaries (can’t go below 0, can’t exceed a maximum)
-
Unequal causes (a few factors dominate instead of many tiny ones)
-
Small samples (random lumpiness looks like a pattern)
-
Outliers (a few extreme values bend the story)
If you want a strong foundation before exam practice, use Notes for SL 4.9: Normal distribution and then test yourself with AI SL 4.9 Normal distribution practice.
In IB Math, “normal” usually comes with hidden walls
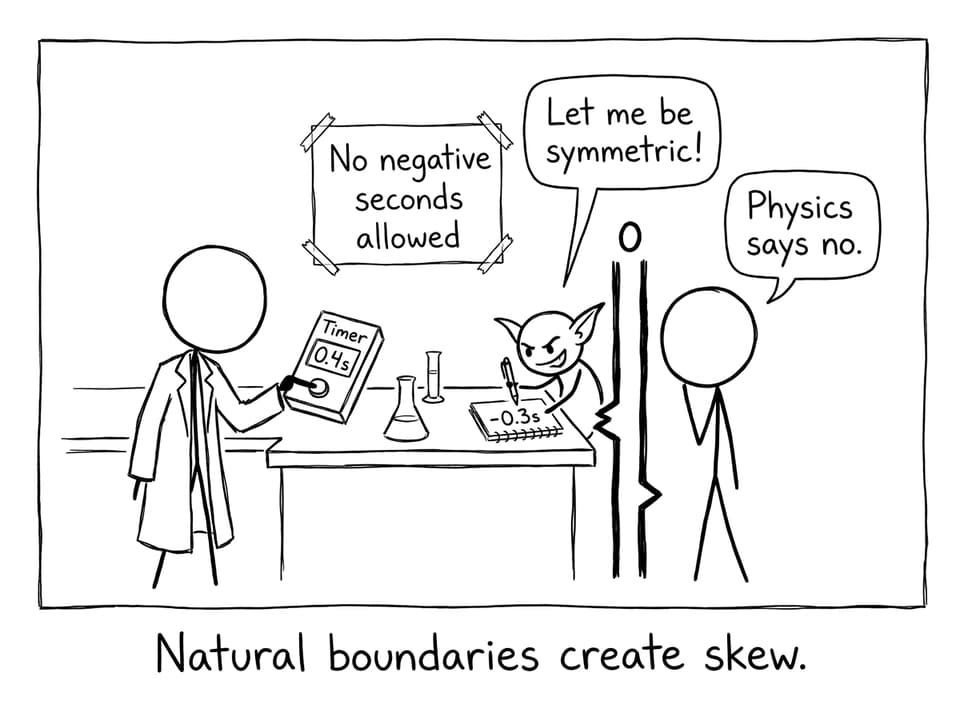
A perfect normal curve stretches forever in both directions. Real measurements usually don’t.
Reaction time can’t be negative. Prices can’t drop below zero. Test scores often have a maximum. These boundaries squash one side of the distribution and create skewness.
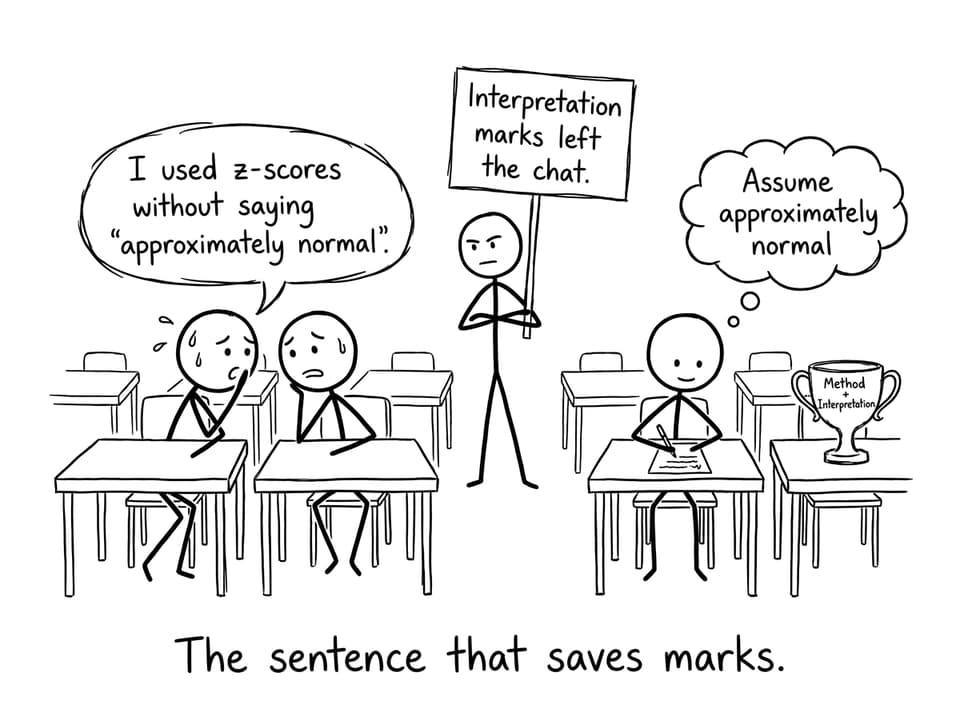
In IB Math, this is a gift: it gives you something intelligent to say. When you’re asked to model with a normal distribution, you can add a line like: “The model assumes an unbounded distribution; however, the context may impose lower/upper limits, so the data may be only approximately normal.” That sentence is often worth more than another decimal place.
The world isn’t built from equal, independent causes
The normal distribution is most at home when lots of small, independent effects add up.
But many real situations aren’t democratic. A couple of big influences can dominate. One teacher writes harder tests than the rest. One measurement tool drifts. One subgroup behaves differently. Instead of a neat bell, you can get clustering, heavy tails, or even a lopsided “almost two-peaks” shape.
If you want to strengthen this part of your IB Math thinking, pair distribution work with core statistics ideas like sampling and outliers in SL 4.1 Introduction to Statistics notes.
Small samples create fake weirdness
A normal curve is what you expect in the long run, not necessarily what you see on Tuesday.
With small sample sizes, randomness shows up as bumps and gaps. Students often interpret that bumpiness as “non-normal,” when it may just be “not enough data yet.” In IB Math, it’s smart to mention sample size as a limitation: it shows you understand the difference between shape and certainty.
To train this exam instinct, practice interpretation-heavy sets in RevisionDojo’s IB Math AI resources hub and use the Math AI Statistics and Probability topic page to target weak spots.
Outliers: tiny points, loud consequences
A single extreme value can pull the mean, inflate the standard deviation, and make a distribution look less symmetric than it “really” is.
In IB Math, you’re not punished for noticing this. You’re rewarded. The exam often wants you to say that data may be approximately normal but affected by outliers, measurement error, or context.
If you’ve ever lost marks by talking about the mean without the spread, read Why students misuse the mean and standard deviation. It’s basically an interpretation bootcamp.
How to write this in an IB Math exam (without overwriting)
A good IB Math response often follows a simple rhythm:
-
State the model: “Let X ~ N(μ, σ²).”
-
Use the tool: z-scores / calculator normalcdf / invNorm
-
Add one honest limitation: “Assumes approximately normal; boundaries/outliers/sample size may affect fit.”
For more structured practice, combine How to master Probability and Statistics in IB Math with targeted drills from the RevisionDojo Questionbank and quick review using Flashcards.
Closing: the calm way to think about “normal”
In IB Math, the normal distribution isn’t a claim about the universe. It’s a useful shortcut that often works well enough to make predictions, compare groups, and communicate uncertainty.
Stop expecting perfection. Start looking for reasonableness. And when your data refuses to be symmetric, don’t panic; explain why, model anyway when instructed, and collect those interpretation marks.
If you want this to feel automatic by exam day, RevisionDojo ties it together with Study Notes, a powerful Questionbank, Flashcards, AI Chat support, and examiner-style Grading tools, plus Predicted Papers and Mock Exams when you’re ready to perform under pressure.