
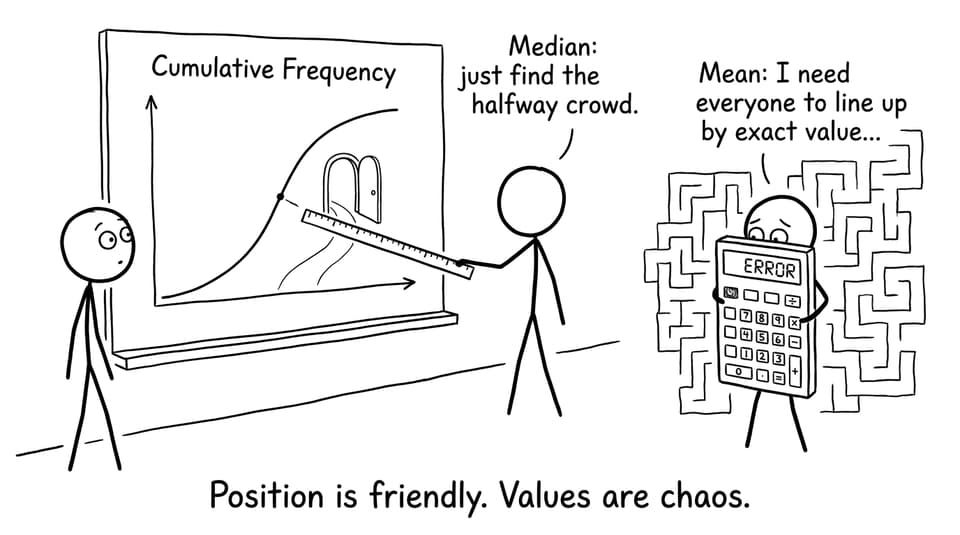
If you’ve ever sat in an IB Math exam with a cumulative frequency (CF) curve in front of you, you’ve probably felt it: the median feels like a fair question, while the mean feels like a trick. Not because you’re missing a formula, but because the graph is quietly telling you what it can (and can’t) reveal.
In IB Math, confidence often comes from knowing the limits of a representation. A cumulative frequency graph is built for positions in the data (middle, quartiles, percentiles). It is not built for the total of all values (which is what the mean needs). Once you see that difference, these questions get calmer.
Quick checklist: what CF graphs are good for in IB Math
Use a cumulative frequency curve (ogive) to:
-
Find the median (50th percentile)
-
Find quartiles (25th and 75th percentiles)
-
Read percentiles and compare distributions
-
Estimate spread ideas like IQR
Use caution if asked to find the mean: it will usually be an estimate, and you should comment on accuracy.
For step-by-step practice, the RevisionDojo bootcamp on working with cumulative frequency is a clean place to drill the basics.
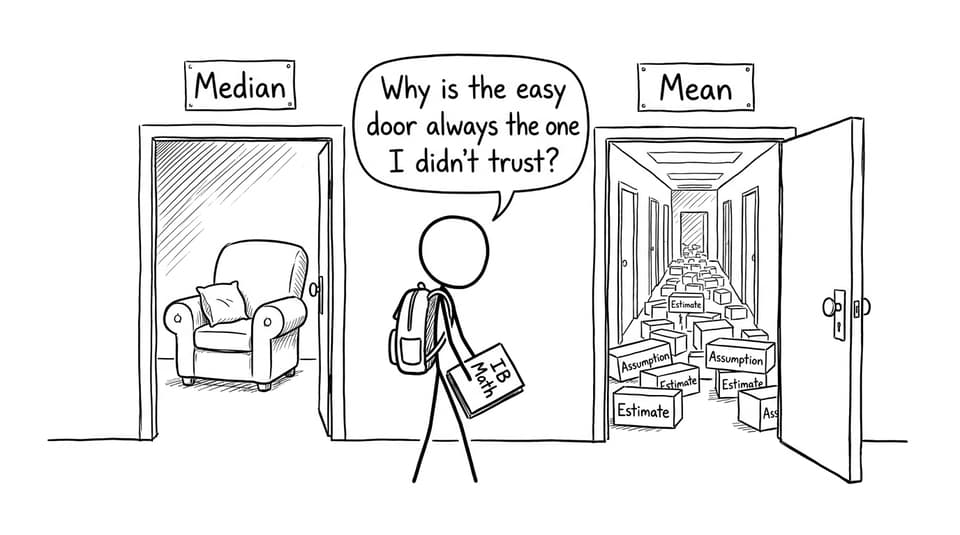
Why the median is easier on a cumulative frequency graph
The median is a location question. In IB Math, that matters because CF graphs are literally “location maps” for the dataset.
You don’t need every data value to find the median. You need only one thing: half the total frequency.
So the method is visually aligned with the graph:
-
Find total frequency, then take (\frac{n}{2})
-
Go horizontally from that frequency to the curve
-
Drop vertically to the x-axis to read the median value
That’s why it feels fair. The graph was designed for exactly that reading process.
If you want more targeted median-and-quartile practice, try box-and-whisker exercises using CF graphs alongside the ogive questions.
Why the mean is harder (and usually only an estimate)
The mean is a totaling question. To compute a mean, you conceptually need to add up every value (or approximate that sum) and divide by (n). But a cumulative frequency curve doesn’t show “every value.” It compresses the dataset into a smooth climb.
In IB Math, that compression is the whole point: the curve is great for how many are below a value, but it hides the exact frequencies in each interval unless you reconstruct them.
So to estimate a mean from an ogive, you typically have to:
-
Choose class intervals (or use given ones)
-
Rebuild frequencies by subtracting cumulative frequencies
-
Use mid-interval values (x_i)
-
Compute (\bar{x} \approx \frac{\sum f_i x_i}{\sum f_i})
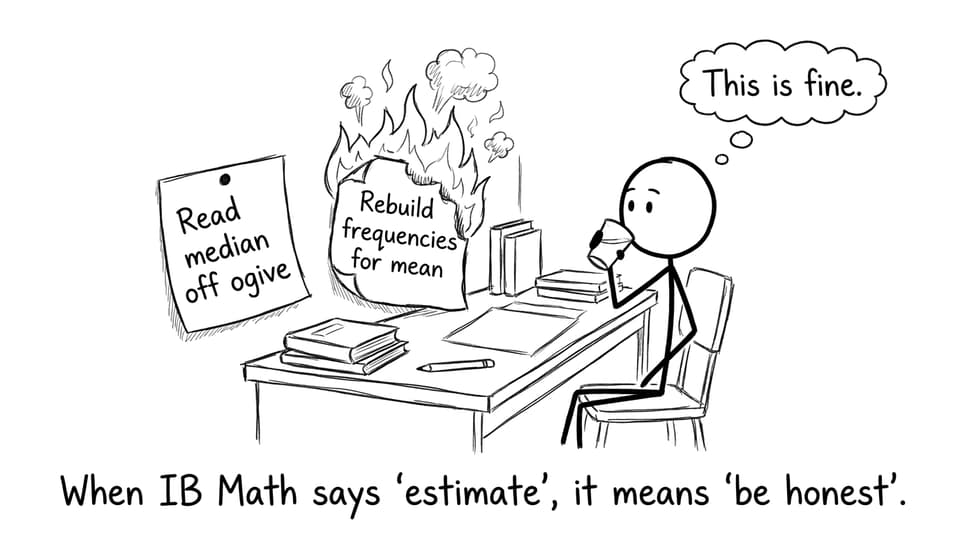
Every step introduces approximation. That’s why exam questions often use wording like “estimate” or “comment on reliability” in IB Math.
For revision of mean calculations in grouped contexts, the RevisionDojo mean, median, mode and spread Questionbank topic is perfect for building speed and method marks.
The hidden exam skill: knowing what the graph can support
A lot of lost marks in IB Math come from treating every question as “just calculate.” But cumulative frequency questions reward judgement.
If the mean is requested from a CF graph, examiners are often checking whether you can:
-
Recognise it cannot be exact
-
Make a sensible estimate (with clear method)
-
Communicate limitations honestly
That interpretive mindset is also why IB likes CF curves in the first place. If you’re curious about the bigger design logic, read why IB questions prefer cumulative frequency over raw tables.
How to practice this fast with RevisionDojo
A good IB Math routine is to separate “read off the curve” skills from “reconstruct grouped data” skills.
-
Use the IB Math AI hub to find the exact Statistics sections you need.
-
Use Study Notes on histograms and CF graphs to lock in the method language.
-
Drill exam-style items in the AI SL presentation of data Questionbank.
-
When you’re stuck, RevisionDojo’s AI Chat can explain why your “mean from ogive” approach is or isn’t reliable.
Conclusion: the graph is telling you what it wants
Cumulative frequency graphs are built for medians, quartiles, and percentiles. That’s why the median in IB Math feels like a straight path, while the mean feels like rebuilding the map. When you treat the mean as an estimate and explain the limitations, you’re doing exactly what IB examiners want: thinking like a statistician, not a calculator.
If you want this to become automatic, use RevisionDojo’s Study Notes, Flashcards, Questionbank, Mock Exams, Predicted Papers, AI Chat, Grading tools, and Tutors to practice the reading skills and the estimation skills separately--then combine them under timed conditions.
