


In IB Math, it’s easy to treat “average” as a synonym for “mean.” You add everything up, divide, and feel done. Then you meet an exam question where the numbers look innocent, your mean is perfectly calculated… and the markscheme wants a discussion of the median.
That moment isn’t unfair. It’s the course doing what IB Math is supposed to do: forcing you to notice when a single extreme value turns a neat calculation into a misleading story.
Quick checklist: median or mean in IB Math?
Use this quick decision filter before you commit to a statistic in IB Math interpretation:
-
Are there obvious outliers? If yes, the median is usually safer.
-
Is the distribution skewed (long tail left/right)? Median often represents “typical” better.
-
Is the context about what most people experience? Median tends to match that.
-
Is the data symmetric with no extremes? The mean can be excellent.
-
Are you being graded on interpretation? You must justify your choice, not just compute.
For practice on exactly this skill, the Mean, Median, Mode topic hub (AI SL 4.3) is a strong starting point.
What the median actually represents (and why IB Math cares)
The median is the middle value after sorting the data. That sounds basic, but in IB Math the key word is middle in a positional sense, not a numerical balancing sense.
The mean tries to “balance” the dataset by using every value. The median asks a different question: Where is the center person standing in the ordered line?
This matters because many real datasets are not polite or symmetric. In those cases, IB Math often rewards the statistic that best matches the real-world interpretation, not the one that feels most mathematical.
If you want a clean syllabus-aligned explanation you can revise fast, open the Mean, Median, Mode notes.
Why the median is less affected by outliers in IB Math
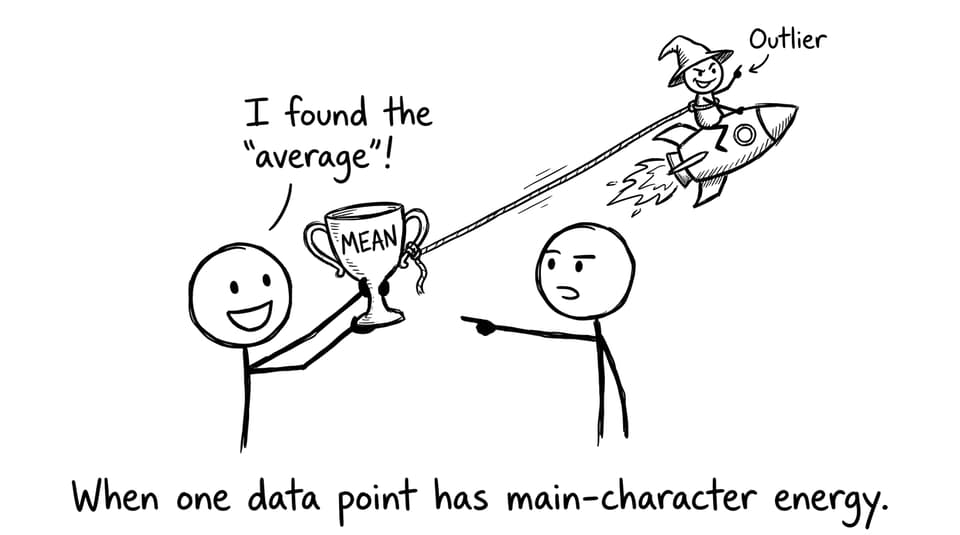
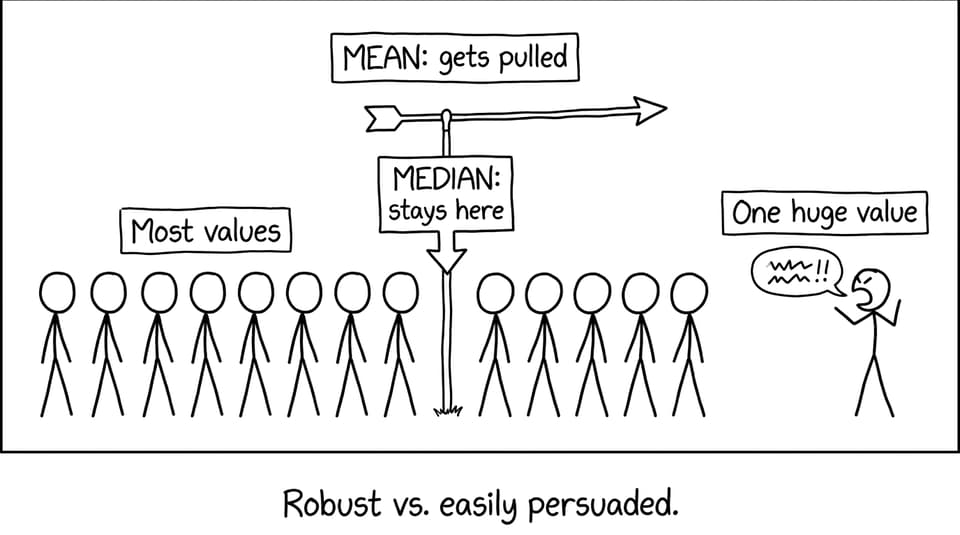
Outliers are the classic trap. One unusually large or small value can shift the mean dramatically, because the mean is built from the total sum.
The median, however, only changes if that outlier crosses the middle position when the data is ordered. Make the outlier slightly bigger or 100 times bigger and the median often stays exactly where it was.
That’s why examiners love phrases like “more robust” and “less sensitive to extreme values.” (And yes, in IB Math, writing one sentence like that can be worth multiple interpretation marks.)
To see how exam questions frame this, try the Mean, Median, Mode Questionbank.
When the median gives a more realistic picture in IB Math
In IB Math, the median is often the better measure when the question is really asking: “What does a typical person/item experience?”
Common contexts:
-
Income (a few very high incomes can inflate the mean)
-
House prices (a handful of luxury homes can distort the mean)
-
Waiting times (a few very long waits can skew the average)
-
Test scores (one extreme score can shift the mean more than you’d expect)
Notice the pattern: these are situations where extremes exist, and the story of “typical” is not the story of “total.”
A helpful related skill is reading distribution from visuals. If you’re revising that too, box plots are a perfect companion topic: Why Do Box Plots Reveal More Than Averages in IB Statistics?.
Why students default to the mean (and how to avoid losing marks)
Most of us learned the mean first, practiced it most, and got rewarded for it early. So under time pressure, the hand moves automatically.
But IB Math is deliberately testing judgement. The mean isn’t “wrong.” It’s sometimes just the wrong choice for the context.
A practical fix: train yourself to spend five seconds scanning for skewness or outliers before calculating anything. This is exactly the kind of habit that turns into free marks over a whole paper.
If you want a broader plan for building those habits, keep a revision framework open like How to Master Probability and Statistics in IB Math.
How IB Math expects you to compare mean and median
When you compare them, aim for a tight, mark-friendly structure:
-
Identify outliers/skewness.
-
State the effect: mean is pulled toward the tail/outlier.
-
Justify: median is more representative/robust.
-
Link back to the context: “typical,” “most people,” “usual outcome,” with units.
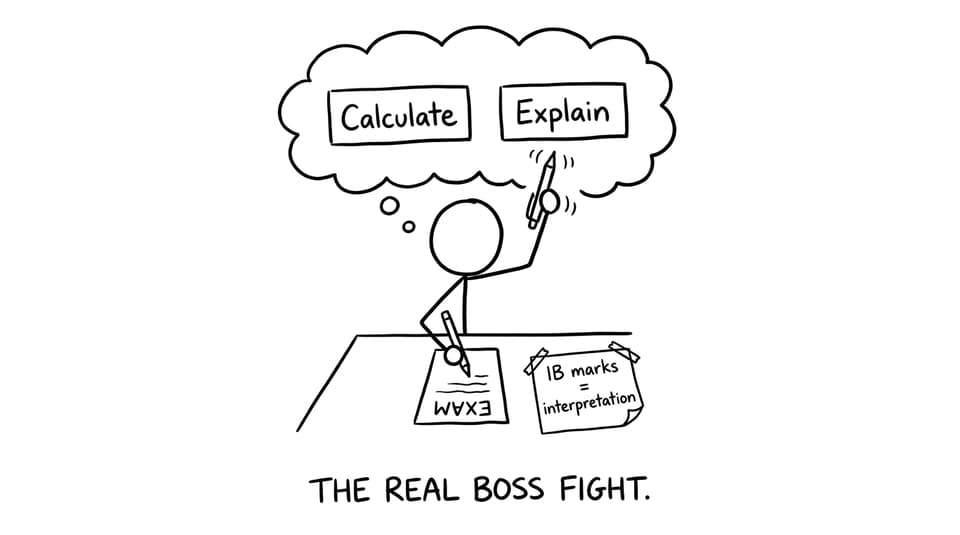
This connects directly to how IB Math grades statistics: interpretation over mechanics. If that idea has ever surprised you, read Why Is Interpretation Graded More Than Calculation in IB Statistics?.
Bring it home: turn “average” into marks with RevisionDojo
In IB Math, the median is sometimes better than the mean for one quiet reason: it tells the story of the typical case when the dataset is lopsided.
RevisionDojo helps you turn that idea into exam performance with targeted Study Notes, daily Flashcards, and exam-style Questionbank practice. When you want quick clarification, AI Chat can help you phrase a median-vs-mean justification in markscheme language, and the Grading tools can show you where interpretation marks are being left on the table. Add Mock Exams, Predicted Papers, and support from Tutors if you want structure and accountability.
If you’re revising this week, open one set from the Statistics and Probability Questionbank and practice writing the one sentence that makes your IB Math answer feel like an examiner wrote it.