

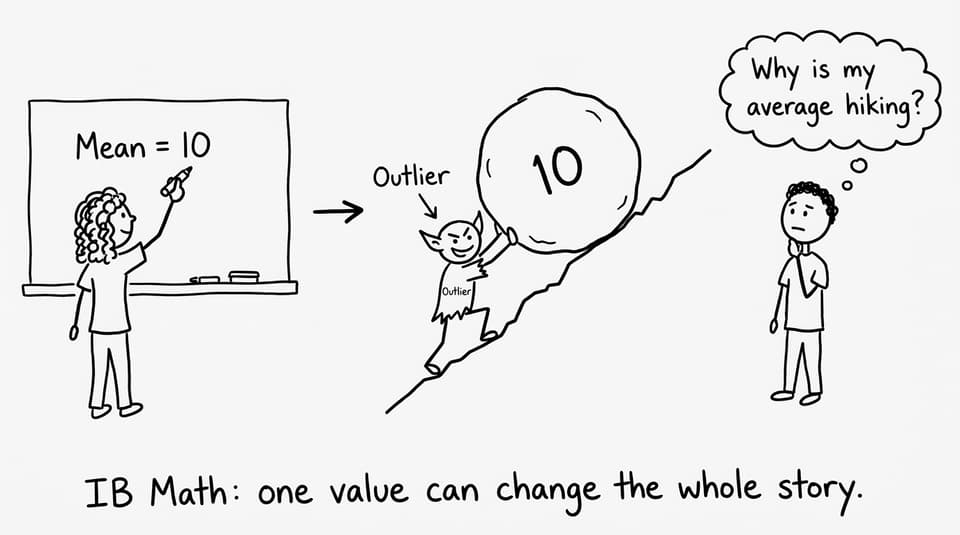
In IB Math, the mean can feel like that one friend who changes plans because a single person texted “maybe.” You calculate an average, it looks precise, and then one extreme value shows up and suddenly the mean no longer describes what most of the data looks like. The annoying part is that nothing “went wrong” with your arithmetic. The mean is doing exactly what it was designed to do.
IB statistics questions love this tension: calculation vs interpretation. If you can explain why the mean shifts so much, you pick up the marks that most students lose.
Quick checklist: what IB wants you to notice about the mean (IB Math)
Before you trust a mean in IB Math, run this quick scan:
-
Is there an outlier (a value far from the rest)?
-
Is the distribution skewed (long tail left or right)?
-
Is the dataset small (so one value has more influence)?
-
Would the median describe “typical” better?
-
Can you write one sentence linking the mean to the context?
If you can do those five things, your answers start sounding like an examiner’s markscheme.
What the mean really measures in IB Math
In IB Math, the mean is not “the most common” value and not “the middle.” It’s the total amount shared equally.
Mathematically, you add every value and divide by how many values there are. Conceptually, imagine redistributing the entire dataset so everyone ends up with the same amount. That final equal-share value is the mean.
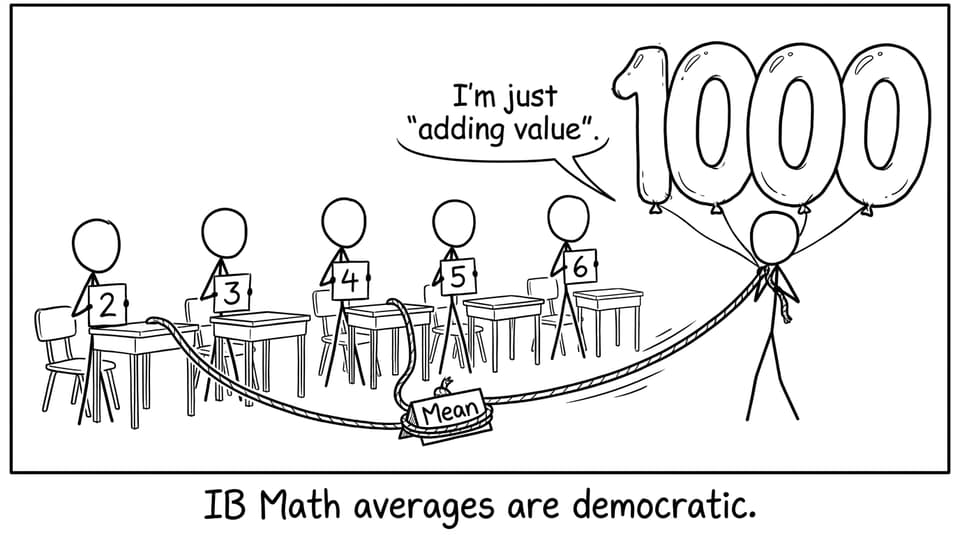
That’s why the mean is sensitive: every data point contributes directly to the total. Typical values and unusual values get the same vote. The mean is democratic, not cautious.
If you want a clean refresher on mean, median, and mode (and how IB phrases them), use RevisionDojo’s notes: Mean, Median, Mode (AI SL 4.3 Notes).
Why extreme values pull the mean so hard
An extreme value changes the mean because it changes the sum by a lot.
Here’s the part that matters for IB Math explanation marks: when you divide by the number of data points, you spread that extreme value’s impact across the whole dataset. So one unusual value quietly influences the “equal-share” result for everyone.
A fast way to see the sensitivity is to think in “mean shift” terms:
-
If you add one extra value to a dataset, the new mean shifts toward that value.
-
The farther the outlier is from the current mean, the bigger the pull.
-
The smaller the sample size, the stronger the effect (because you’re dividing by a smaller number).
So yes, the mean is correct. It’s just not always representative.
For targeted practice on this exact skill, RevisionDojo’s Mean, Median, Mode (AI SL 4.3) section pairs explanations with exam-style questions.
Why students over-trust the mean (and IB knows it)
Most students were trained to treat the mean as “the” average. That habit works in neat, symmetric classroom data. But IB statistics leans toward messy reality: incomes, house prices, reaction times, experimental errors, unusual events.
IB examiners are often checking whether you can do more than compute. They want you to ask: Does this mean describe what’s typical, or is it being pulled?
If you want to build this bigger “data awareness” mindset across topics, this is a strong companion read: How to Master Probability and Statistics in IB Math.
When the mean is a poor summary in IB Math statistics
In IB Math, the mean can be misleading when:
-
There are strong outliers
-
The distribution is heavily skewed
-
The context naturally creates extremes (money, waiting times, rare events)
A smart examiner-style sentence is something like:
“The mean is influenced by the outlier, so it may overestimate the typical value; the median may be more representative.”
If your questions include box plots, you can often see this immediately. RevisionDojo breaks that interpretation down clearly here: Box and Whisker Plot in IB Math and Why Do Box Plots Reveal More Than Averages in IB Statistics?.
Why IB compares mean and median so often (IB Math)
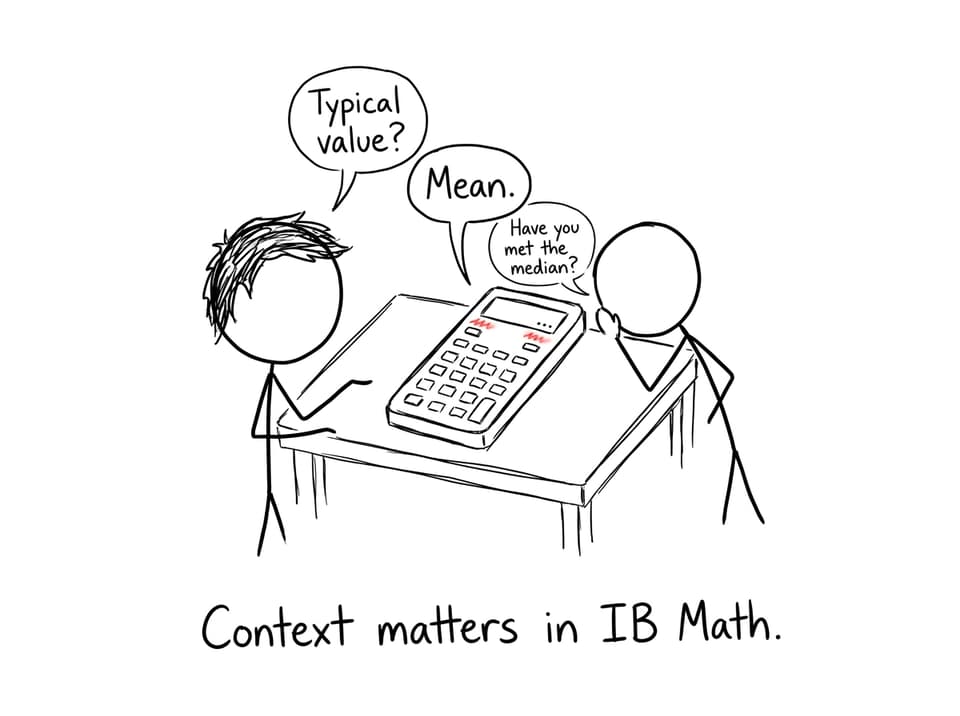
The median is resistant to extremes because it depends on position, not magnitude. One huge outlier can’t drag the median across the number line the way it drags the mean.
So in IB Math:
-
Mean vs median close together often suggests symmetry and few extreme values.
-
Mean greater than median often suggests right skew (a high tail).
-
Mean less than median often suggests left skew (a low tail).
This is exactly the kind of interpretation that turns a 2-mark calculation into a 4-mark response.
Common IB Math mistakes with the mean
The mean usually isn’t where marks are lost. The explanation is.
Students often:
-
State the mean like it’s automatically “typical”
-
Ignore the presence of an outlier
-
Forget to mention skewness when it’s visible
-
Give conclusions with no context (numbers without meaning)
To train away those habits, RevisionDojo’s Statistics and Probability Questionbank (AA) and AI SL 4.3 Questionbank are built for repetition with feedback. Pair them with Flashcards for definitions (outlier, skewness, IQR), and use AI Chat to practise writing 2-sentence interpretations that sound examiner-ready.
Closing: turn mean sensitivity into easy exam marks (IB Math)
In IB Math, the mean is sensitive to extreme values because it treats every value as equally real and equally important in the total. That’s honest mathematics, but sometimes it’s a misleading description of what’s “typical.”
If you want your statistics answers to earn full marks, train the interpretation habit: spot outliers, comment on skewness, compare mean and median, and link your conclusion to context. RevisionDojo makes this simpler with targeted Questionbank drills, clear Study Notes, quick Flashcards, exam-style Grading tools, and confidence-building Predicted Papers and Mock Exams--plus AI Chat when you need to practise wording on demand.