
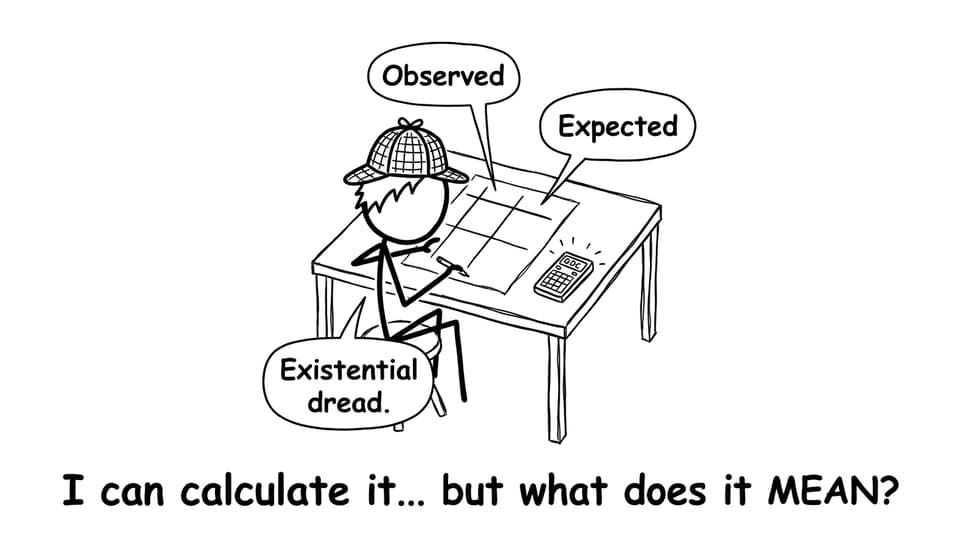
In IB Math, the chi-squared test is the rare topic that can make you feel simultaneously confident and lost. Confident because the steps look mechanical: fill the table, compute expected frequencies, plug into a formula. Lost because the moment you have to explain what you just did, the ground disappears.
That gap is exactly why chi-squared feels so conceptually hard in IB Math. The IB isn’t primarily testing arithmetic here. It’s testing whether you understand what “evidence” means, how a null hypothesis behaves, and why “surprising” data is different from “impossible” data.
A quick chi-squared checklist for IB Math exams
Use this as your mental script before you write a single number:
-
State H₀ using independence (or “fits the stated distribution” for goodness of fit).
-
State H₁ as association (or “does not fit”).
-
Compute expected frequencies from the assumption that H₀ is true.
-
Calculate (\chi^2 = \sum \frac{(O-E)^2}{E}).
-
Find degrees of freedom and compare with a critical value or p-value.
-
Conclude in context using careful language: “evidence of association” not “proof.”
If you want the syllabus-aligned walkthrough, the SL 4.11 chi-squared notes and SL 4.11 videos are the cleanest starting point.
What the chi-squared test is really doing in IB Math
A useful way to think about chi-squared in IB Math is this: it measures how awkward your observed table would look if the world really followed your null hypothesis.
Not “awkward” as in emotionally uncomfortable (though yes). Awkward as in statistically unlikely.
So the test is not asking, “Are these numbers different?” They’re almost always different. It’s asking, “Are these differences too large to plausibly blame on random variation?” That’s why the ending is a probability statement (p-value) or a comparison to a critical boundary.
The concept students miss is that the test lives inside a story:
-
We pretend there is no association (H₀).
-
Under that pretend-world, we generate the expected counts.
-
Then we check how far reality drifts from the pretend-world.
That story is the conceptual heart of chi-squared in IB Math.
Why “expected frequency” feels unnatural
Expected frequency sounds like a prediction. In everyday language, “expected” means “what you think will happen.” In IB Math, expected frequency means “what would happen if H₀ were true.”
That’s a different kind of expectation: not confidence, but conditional logic.
So when you calculate expected frequencies, you are not forecasting. You are building a baseline reality where variables are independent (or where the stated distribution is true). The expected table is the quiet, boring version of the world. Your observed table is what actually happened.
Students lose marks when they treat expected values like guesses instead of consequences of the null hypothesis.
To practise the “setup language” side (where most explanation marks live), try the chi-squared independence hypothesis and critical region exercises.
Why the statistic feels meaningless (until you learn the trick)
The (\chi^2) value itself doesn’t come with a built-in interpretation. A (\chi^2=8.2) is not “good” or “bad” in isolation.
That’s unsettling in IB Math because many topics reward direct meaning: slope means rate, area means accumulation, a derivative means gradient. Chi-squared is different. It only gains meaning through a comparison.
Here’s the trick: treat (\chi^2) like a “distance” between observed and expected.
-
Small (\chi^2): observed counts are close to expected counts (differences look like noise).
-
Large (\chi^2): observed counts are far from expected counts (differences look too structured to ignore).
The comparison step is where the story resolves. If you want exam-style repetition until this feels automatic, use RevisionDojo’s Statistics & Probability Questionbank for IB Math AA.
Association vs causation: the wording trap that costs marks
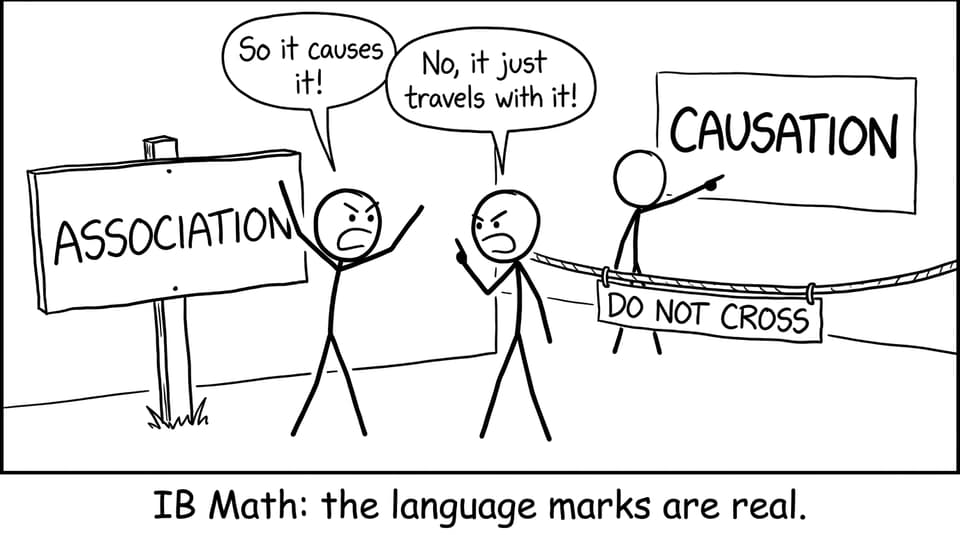
Chi-squared can support “there is an association.” It cannot justify “A causes B.” And in IB Math, that single verb swap can be the difference between full communication marks and a painful penalty.
Why? Because association is a pattern in categorical data. Causation is a claim about mechanism, control, and alternative explanations. A contingency table cannot control confounding variables. It cannot randomize. It can only show that categories co-occur in a way that would be surprising under independence.
If you keep losing marks on interpretation across statistics topics, it’s worth reading How to Solve Real-World Problems with Statistics (Data Toolkit) because it trains the exact “explain like an examiner” habit.
How RevisionDojo helps chi-squared finally click
When chi-squared feels hard in IB Math, it’s usually because practice has been too calculation-heavy and too feedback-light.
RevisionDojo fixes that loop:
-
The Study Notes and Videos anchor the story of H₀, expected counts, and evidence.
-
The Questionbank gives you targeted chi-squared sets with exam-style wording.
-
Flashcards help you rehearse the exact phrasing IB markschemes reward.
-
AI Chat can drill your conclusion sentences until they sound precise, not vague.
-
Grading tools and Mock Exams help you test whether you can explain under time pressure.
-
Predicted Papers give you realistic rehearsal for what your next exam may emphasize.
-
Tutors help when the sticking point isn’t math, but the mental model.
For course context, start at IB Mathematics Analysis and Approaches resources or browse the IB Math AA Statistics & Probability topic page.
The bottom line
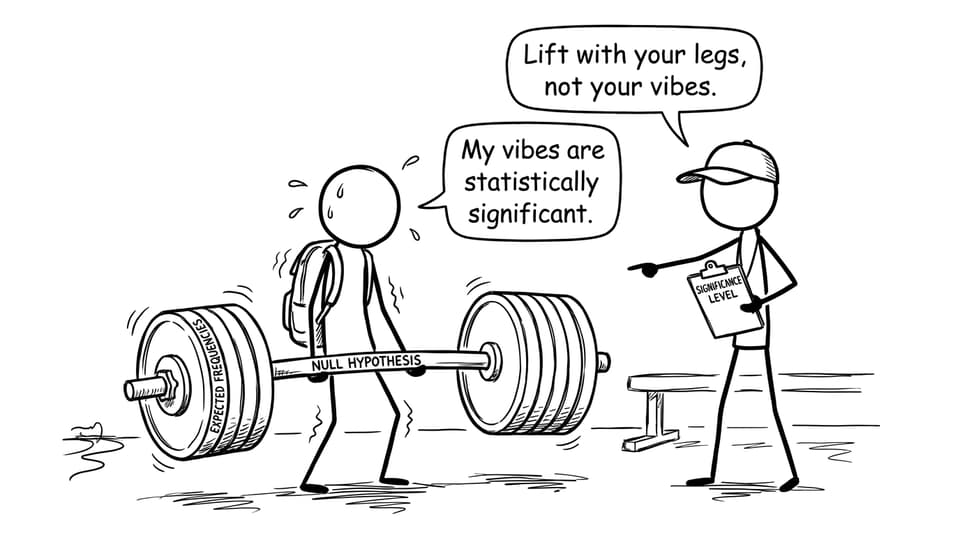
Chi-squared is conceptually hard in IB Math because it asks you to think like an investigator: assume innocence (H₀), compute what the world would look like, then decide whether the evidence is surprising enough to doubt that assumption.
If you want this topic to feel calm by exam day, build your routine around explanation-first practice: learn the story, drill the wording, then time yourself. Start with the chi-squared notes, reinforce with the videos, and then grind exam-style sets in the IB Math Questionbank until the conclusion sentences feel automatic.


