



The moment you stop trusting your pencil
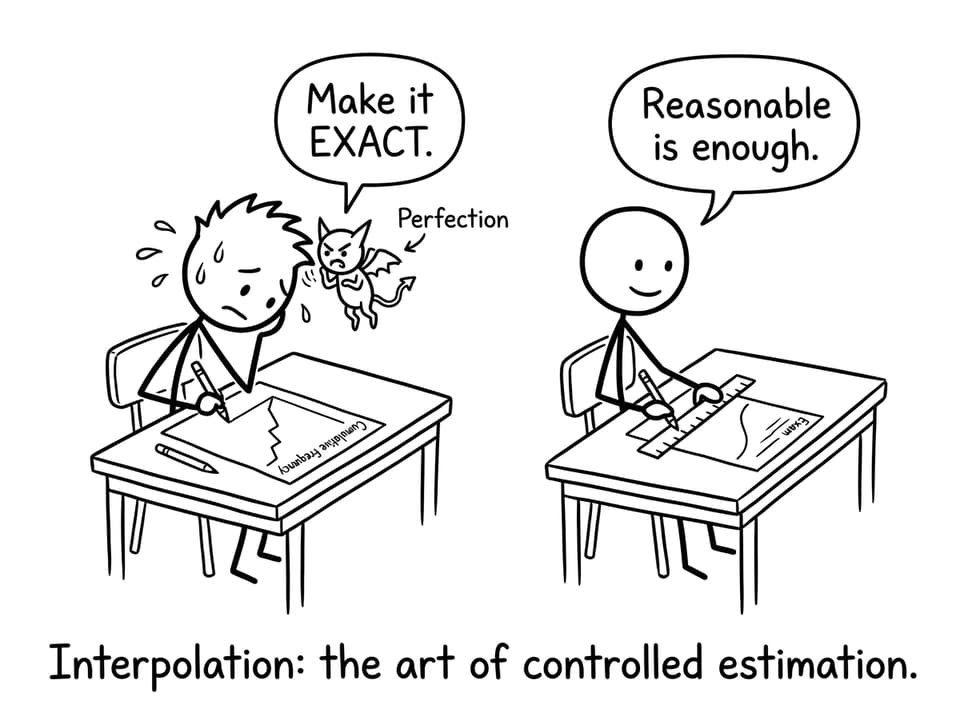
In IB Math, interpolation on a cumulative frequency (CF) graph has a special talent: it makes confident students suddenly hover their ruler above the page like it’s a risky decision. You draw the horizontal line. You meet the curve. You drop the vertical. Then you pause and think, “Is that really the median… or did I just invent a number?”
That feeling isn’t you being bad at IB Math. It’s your brain noticing something true: interpolation is built on controlled uncertainty. And the IB actually wants to see how you handle that uncertainty calmly, with method.
A quick checklist for safer interpolation (without overthinking)
-
Find the total frequency first, then locate the target CF value (e.g., median = 50%).
-
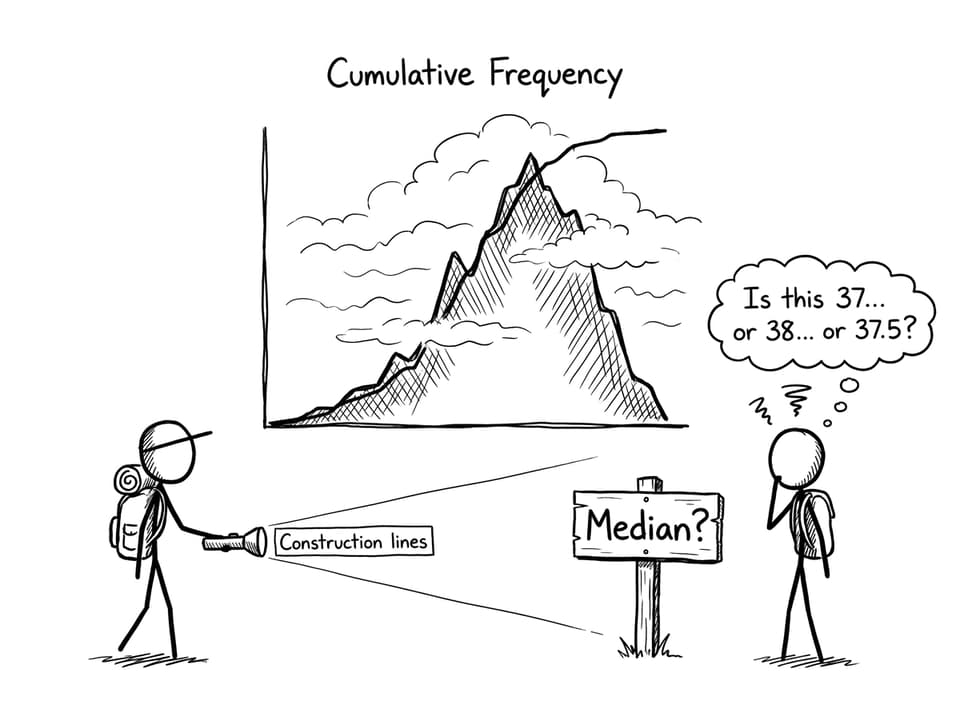
Use construction lines (horizontal to the curve, vertical to the axis).
-
Read scales slowly and label units.
-
Round sensibly (usually to 1 dp or the graph’s resolution).
-
Keep going even if the value feels “not exact”, follow-through marks reward consistent reasoning in IB Math.
For guided practice on CF graphs, start with SL 4.2.b Working with the cumulative frequency and the matching Bootcamp practice for cumulative frequency graphs.
Why interpolation on cumulative frequency graphs feels uncertain in IB Math
The curve hides the raw data
A CF curve looks smooth, but it’s really a summary of grouped data. That means you never see individual values, and you often don’t even see what happens inside each class interval. In IB Math, interpolation asks you to estimate a value that lives “between” boundaries you can’t fully inspect.
This is why the answer can feel like a guess even when your method is correct. You’re reading a model of the data, not the data itself.
If CF graphs already feel like they require “thinking backwards,” you’ll relate to Why Cumulative Frequency Graphs Feel Hard to Read.
There isn’t one single perfect value
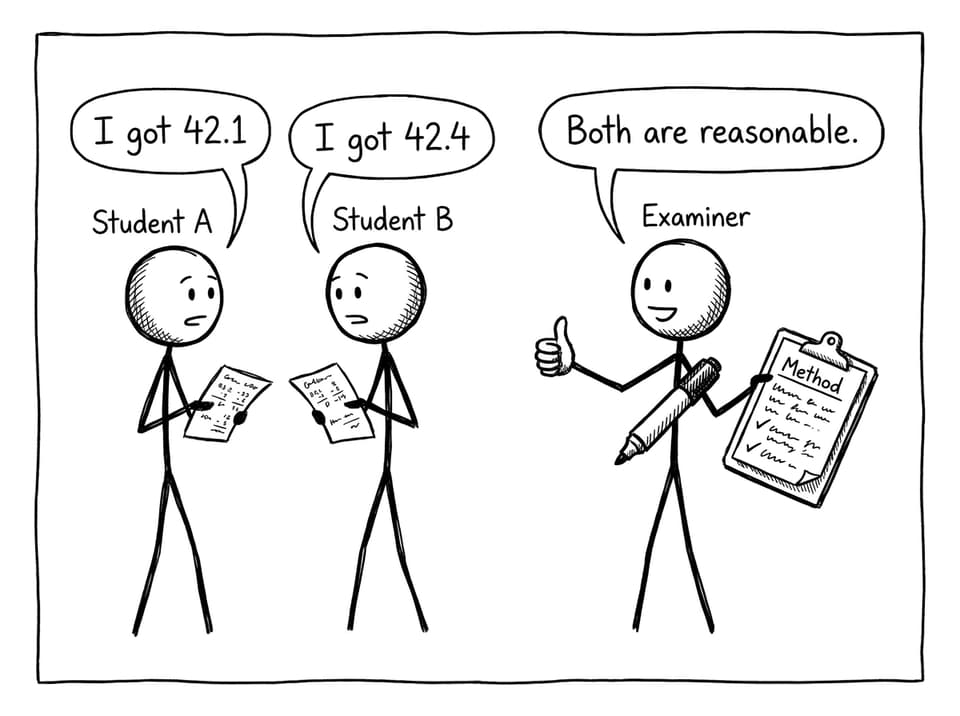
Traditional school maths trains you to expect one correct answer. But in IB Math, two students can do clean interpolation and land on slightly different readings because:
-
their construction lines meet the curve at slightly different spots
-
their eyes interpret the curve thickness differently
-
their rounding choices differ
That’s not a flaw. It’s the point. The IB is testing judgement and communication, not microscopic precision.
Your hand becomes part of the calculation
Interpolation is one of the few places where your technique matters physically: ruler placement, line thickness, and how confidently you commit to a reading. Under exam pressure, students redraw lines repeatedly, which creates a loop: more edits, more doubt.
A practical fix: draw lightly once, label clearly, and move forward.
Quartiles and percentiles raise the stakes
Interpolation often feeds into quartiles, percentiles, IQR, and box plots. So students fear that a small early reading error will wreck everything later. But IB Math marking is designed to reward consistent method. If you show clear steps, follow-through marks usually protect you.
If quartiles from a curve feel especially slippery, read Why Students Misread Quartiles on Cumulative Frequency Curves.
How RevisionDojo makes uncertainty feel manageable
The fastest way to get comfortable with interpolation in IB Math is to see many versions of the same skill until your brain stops treating it like danger.
RevisionDojo helps you do that with:
-
Questionbank practice on CF graphs like AI SL 4.2 Presentation of Data Questionbank and the broader Math AI Statistics and Probability Questionbank
-
Study Notes like SL 4.1 Introduction to Statistics Notes
-
Flashcards to keep definitions (median, quartiles, percentiles) effortless
-
AI Chat that explains why your reading is reasonable, not just whether it matches a single number
-
Grading tools that focus on method marks (the real currency in IB Math)
-
Mock Exams and Predicted Papers for pressure-proofing your graph technique
-
A Coursework Library and Tutors when statistics confidence needs a reset, not another worksheet
A calmer way to think about IB Math interpolation
Interpolation feels uncertain because it is uncertain: you are estimating from a smoothed summary, not retrieving an exact hidden value. But in IB Math, that’s not a weakness; it’s a skill. If you show clear construction lines, sensible rounding, and consistent follow-through, you’re doing what the IB is actually assessing.
If you want interpolation to feel like routine instead of risk, practice it the way it appears in exams using RevisionDojo’s cumulative frequency lessons and practice plus targeted drills in the Math AI Statistics and Probability hub. The uncertainty doesn’t disappear, but your control over it does.