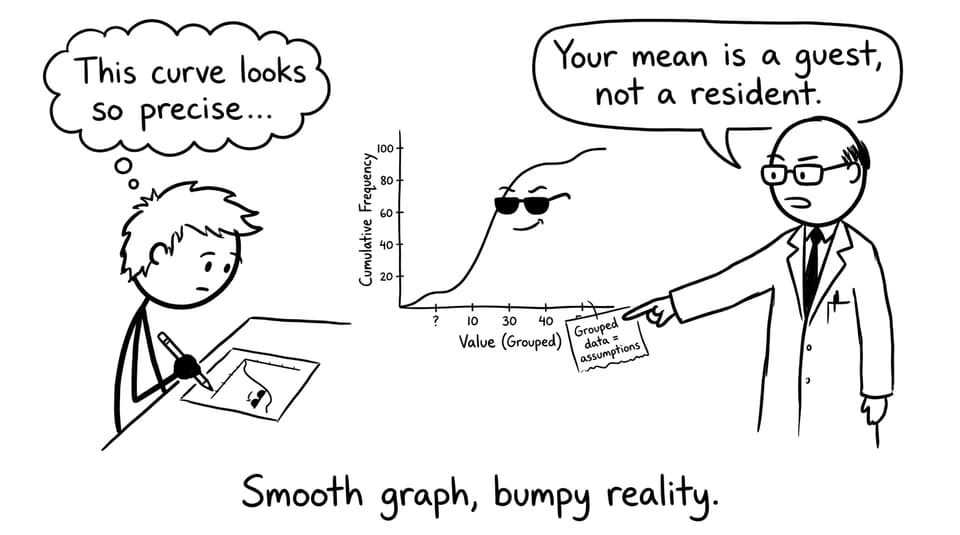
In IB Math, few things feel as deceptively safe as a smooth cumulative frequency (CF) curve. It looks clean, continuous, and confident, like the graph is quietly telling you, “Don’t worry, I’ve already done the messy part.”
But estimating the mean from a cumulative frequency graph is risky for the exact same reason it feels comforting: the curve hides the mess. And in IB Math exams, hidden mess is where marks quietly disappear.
The quick checklist (what makes it risky in IB Math)
Before you trust your answer, scan this checklist:
-
You must reconstruct frequencies from a curve (not read them directly).
-
You must choose class intervals and midpoints (more assumptions).
-
The curve can hide different distributions that produce similar shapes.
-
Small reading errors compound into a bigger mean error.
-
Examiners often reward the limitation comment as much as the number.
If you want structured practice on CF graphs, start with SL 4.2.b Working with the cumulative frequency, then reinforce the wider chapter with SL 4.2, Presentation of data.
Why estimating the mean from a cumulative frequency curve is uncertain
In IB Math, the mean is sensitive because it uses every value (or every grouped midpoint). A CF graph, however, gives you running totals, not the “per class” frequencies you actually need.
So you end up doing something like this:
-
Pick class boundaries (often guided by the question).
-
Read cumulative frequencies at boundaries.
-
Subtract to find class frequencies.
-
Multiply each class frequency by its midpoint.
-
Divide by total frequency.
Each bullet point contains a small judgement call. Any tiny misread of the curve, any slightly off midpoint, any rushed subtraction, it all travels forward into the final mean.
For extra exam-style mean practice beyond CF curves, RevisionDojo’s mean, median, mode Questionbank is a good place to build speed without losing method marks.
A smooth curve can hide a lumpy distribution (classic IB Math trap)
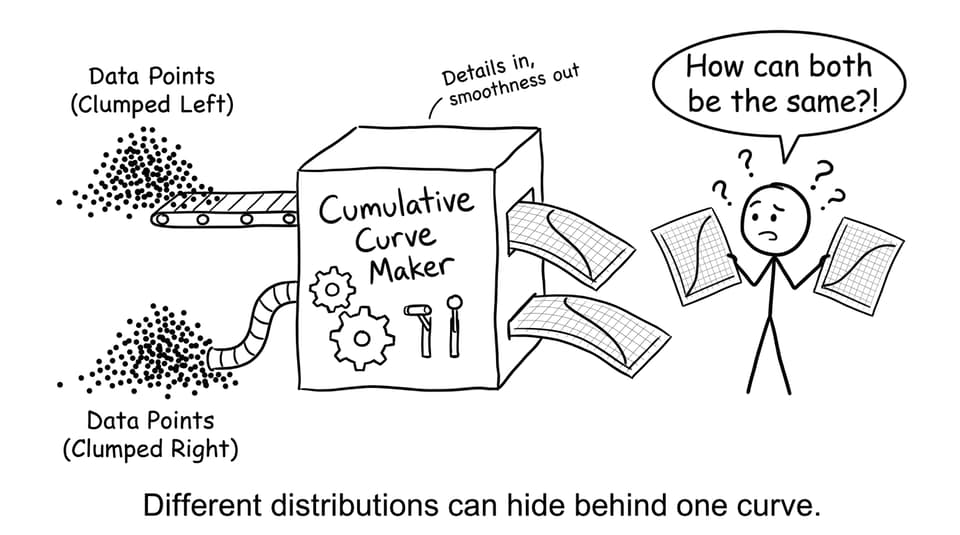
Two data sets can produce a very similar cumulative curve while having very different internal structure inside each interval. That’s the quiet danger: the CF curve tells you how many values are below a point, but it does not tell you how values are spread inside a class.
When you estimate a mean, you’re effectively saying: “Within each interval, values behave nicely enough that the midpoint is a fair representative.” Sometimes that’s reasonable. Sometimes it’s wildly optimistic.
If CF graphs still feel strange to read, Why Cumulative Frequency Graphs Feel Hard to Read helps you translate the curve into positional thinking (which is what IB Math really wants).
The exam-time problem: precision feels productive, but it’s expensive
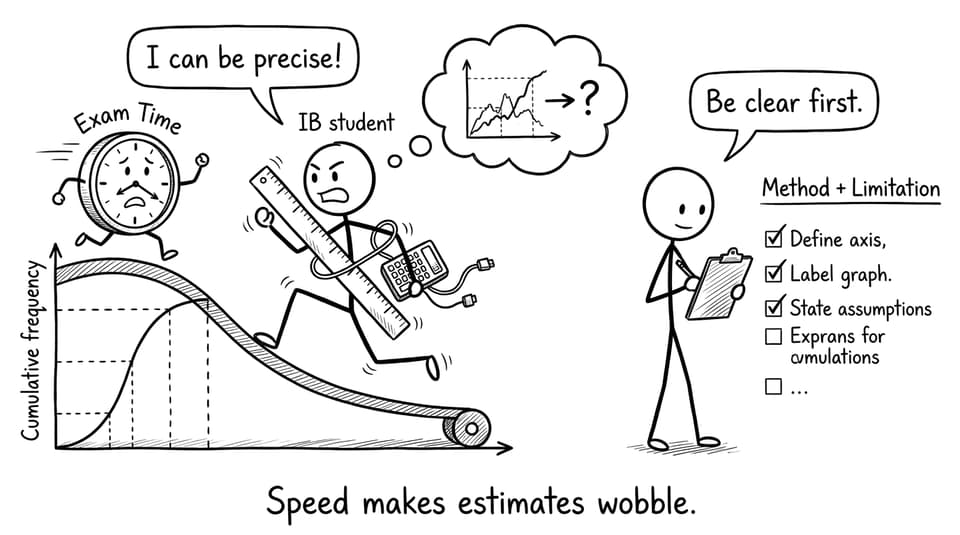
In IB Math exams, estimating the mean from a cumulative frequency graph often costs more time than finding medians or quartiles. And time pressure creates a specific kind of error: you start “tidying” your estimate to look exact.
You redraw lines. You second-guess readings. You recalculate the same subtraction twice. Then you make an arithmetic slip anyway.
The best scoring students do something calmer:
-
show clean construction and subtraction clearly,
-
compute the estimate efficiently,
-
then state the key truth: it is only an estimate because the data is grouped and read from a curve.
That last sentence can be the difference between a fragile answer and a resilient one.
To see how IB often follows up with “interpretation marks,” read Why Students Misread Quartiles on Cumulative Frequency Curves and Why IB Questions Prefer Cumulative Frequency Over Raw Tables.
How to protect marks on these questions (IB Math strategy)
When you estimate a mean from a CF graph, aim for transparent method + honest interpretation:
-
Use clear class boundaries and show how you found each class frequency.
-
Use midpoints consistently and write the midpoint list.
-
Keep your arithmetic readable (table format helps).
-
Round sensibly (don’t pretend it’s exact).
-
Add a limitation statement: grouped data, interpolation from curve, midpoint assumption.
If you want targeted repetition on these skills, RevisionDojo’s Statistics and Probability Questionbank for IB Math AI and SL 4.1, Introduction to Statistics Notes keep the language and method aligned with examiner expectations.
Closing: treat the mean like a cautious conclusion
In IB Math, estimating the mean from cumulative frequency graphs is risky because the curve looks more certain than it is. Your job is not to pretend the estimate is perfect. Your job is to show a clean method, make sensible choices, and communicate why the answer has limitations.
If you want to get consistently confident with CF graphs, RevisionDojo is built for it: practice with the Questionbank, tighten your wording with Study Notes and Flashcards, sanity-check steps with AI Chat, and train exam timing using Mock Exams and Predicted Papers. When the graph gets “smudgy,” your method doesn’t have to.


