


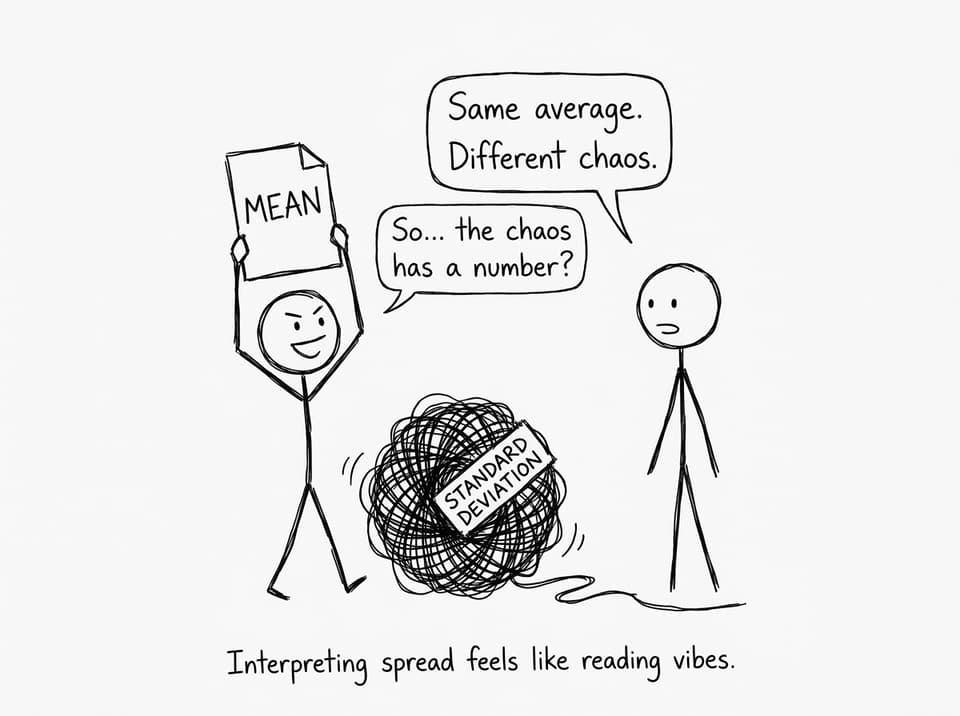
Standard deviation is the moment many IB Math students realize statistics is not just calculation, it’s judgment.
You finish the arithmetic, your calculator gives a clean number, and then the question asks: “Interpret.” The mean feels friendly because it points to a single, typical value. Standard deviation feels slippery because it asks you to describe uncertainty in plain language. And uncertainty is harder to talk about than an average.
The quick interpretation checklist (IB Math-friendly)
When you see a standard deviation in IB Math, run this quick script:
-
Name the center: “The mean is …”
-
Translate the spread: “A typical value is about … units away from the mean.”
-
Compare if needed: “Dataset A is more/less variable than Dataset B.”
-
Attach meaning: consistency, reliability, risk, predictability
-
Stay in context units: marks, minutes, cm, dollars (not “percent” unless told)
If you want the formal foundations, the notes on mean and standard deviation (SL 4.3) make the examiner language feel much more repeatable.
What standard deviation actually measures (and why that’s abstract)
The mean answers: “Where is the data centered?” That’s a location you can point to.
Standard deviation answers: “How far do values typically wander from that center?” That’s a pattern of movement, not a place.
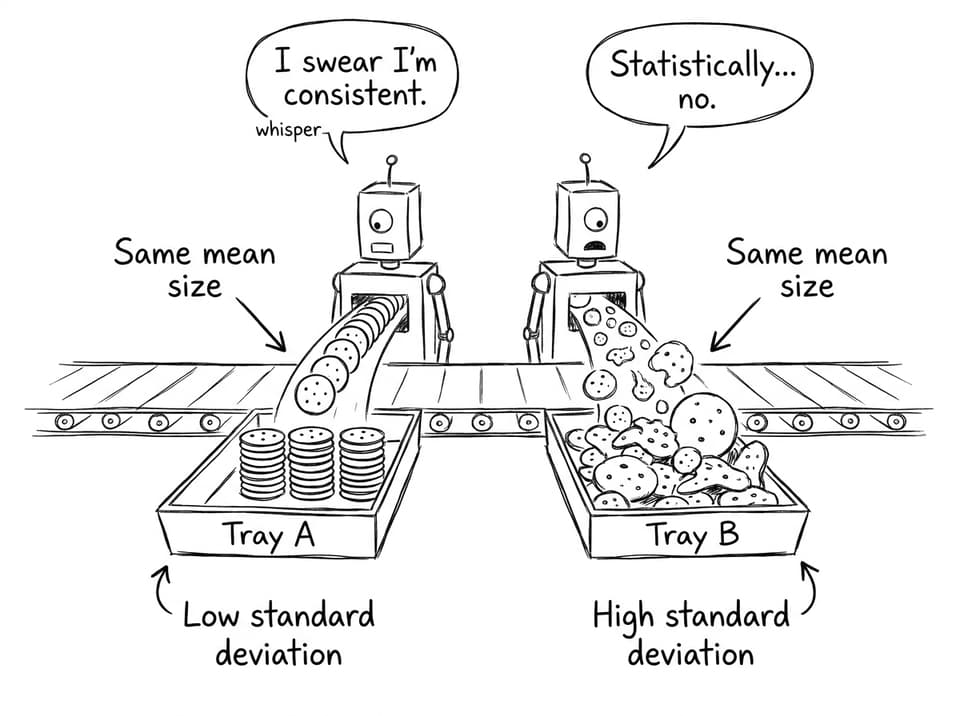
In IB Math, this matters because the standard deviation is a measure of variability. A small standard deviation means values are tightly clustered, so outcomes are more consistent. A large standard deviation means the data are more spread out, so the mean becomes a weaker “typical” prediction.
RevisionDojo explains this relationship clearly in Why students misuse the mean and standard deviation, which is basically an examiner’s checklist of what students forget to say.
Why the mean feels easier in IB Math exams
A mean is a headline. It compresses a whole dataset into one number that sounds like a “typical result.” Your brain likes that.
Standard deviation is more like the article under the headline. It forces you to hold two ideas at once:
-
The mean tells you the center.
-
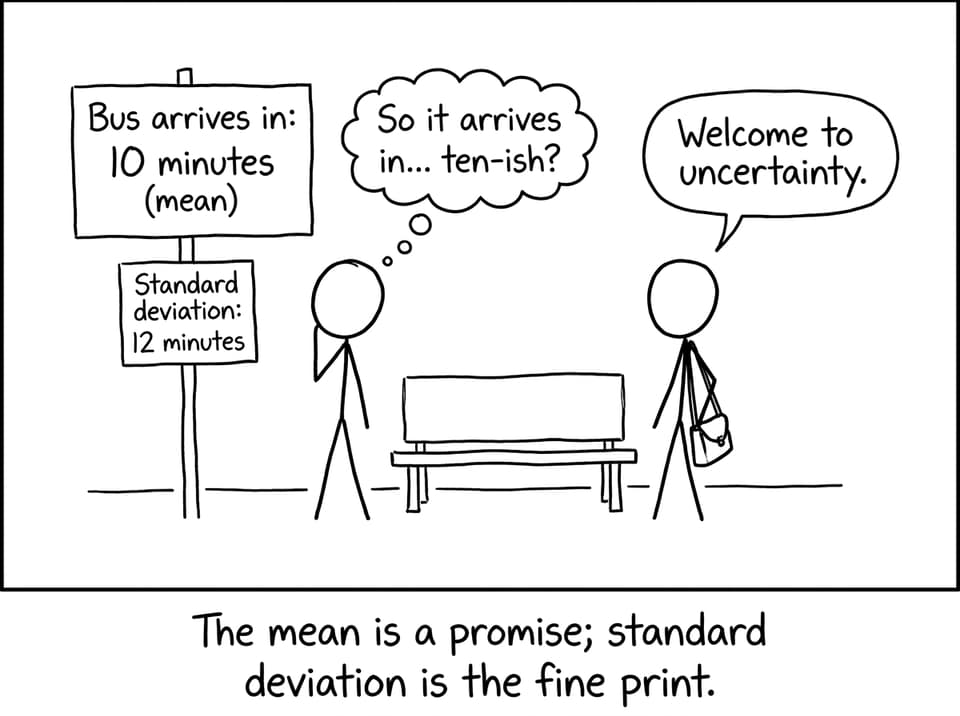
The standard deviation tells you how trustworthy that center is.
That second idea is where interpretation marks live. If you only report the value of standard deviation, you’ve done the computing, but not the thinking.
Where standard deviation matters more than the mean
Two datasets can share the same mean and still feel completely different to live through:
-
Two classes can average the same score, but one class might be consistent and the other wildly uneven.
-
Two commute times can average 30 minutes, but one is predictable and the other constantly late.
-
Two study plans can produce the same average practice score, but one produces reliable performance under time pressure.
That last one is why IB Math leans on interpretation: it’s training you to make decisions, not just do procedures. If you’re practicing interpretation, the IB Math AI subject hub is the fastest way to cycle through realistic questions.
The most common interpretation mistakes
These patterns show up again and again in IB Math exam scripts:
-
Treating standard deviation like “another average”
-
Saying “the standard deviation is 6” and stopping
-
Comparing means but ignoring spread
-
Forgetting units (or calling it a percent)
-
Calling a larger standard deviation “bad” without context
If you want a clean way to phrase it, this post on why low standard deviation doesn’t always mean better helps you avoid value judgments and stick to what the statistic actually claims.
How to train interpretation quickly with RevisionDojo
Interpretation is a skill you build by repeating the same sentence structure across many contexts.
Use RevisionDojo’s Questionbank to drill topic-by-topic (and get feedback with Grading tools) via the Questionbank feature page. Then use Study Notes to patch the exact gap you missed, and Flashcards to keep the language in your head.
When you’re closer to exam season, add realism: Mock Exams and Predicted Papers force you to interpret under time pressure, which is where standard deviation usually falls apart. If you’re in Math AI, the Math AI Papers page and the free Math AI predicted papers are built for that.
If you get stuck mid-solution, use AI Chat to ask: “What is a full-mark interpretation sentence here?” And if you want human strategy, RevisionDojo Tutors can help you build a reusable phrase bank tailored to your weak areas.
Closing: make spread feel like a sentence, not a number
Standard deviation feels harder than the mean because it measures variability, not “typical value.” But in IB Math, that’s exactly the point: the examiner wants to know if you can describe consistency, reliability, and uncertainty.
If you can calculate standard deviation, you’re halfway there. The other half is building a repeatable interpretation sentence. Use RevisionDojo’s Study Notes, Flashcards, Questionbank, AI Chat, and Grading tools to practice that sentence until it becomes instinct. Then use Mock Exams and Predicted Papers to prove you can do it when the clock is running.
