

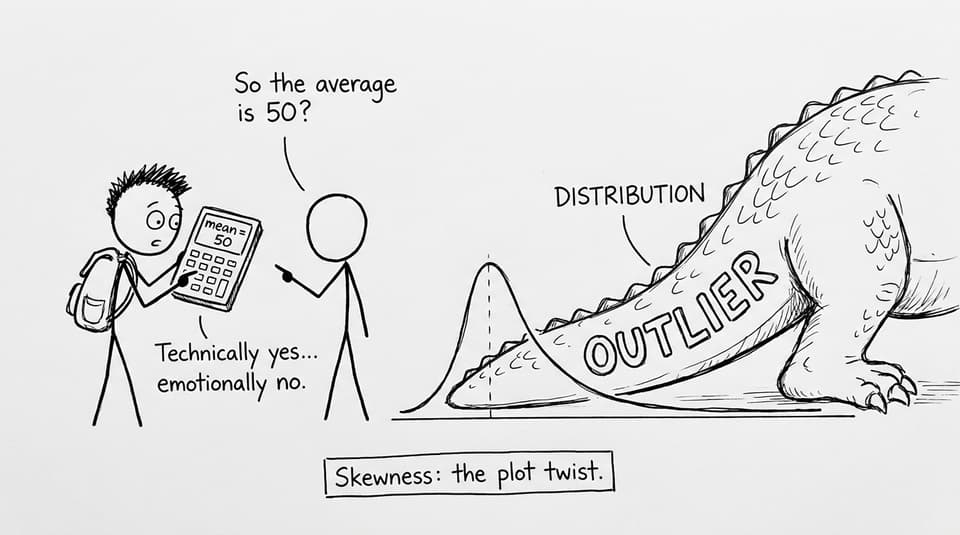
Skewness is the kind of detail you ignore right up until it costs you marks.
In IB Math, especially when statistics questions ask for “comment,” “interpret,” or “justify,” the shape of a distribution isn’t decoration. It’s evidence. A dataset can look perfectly reasonable on the calculator screen, then quietly tilt to one side and make your “average” feel suspicious. That tilt--skewness--often decides whether your interpretation sounds like a statistician or like someone reading numbers out loud.
What skewness actually tells you in IB Math
Skewness is simply asymmetry: the distribution has a longer tail on one side.
-
Positive (right) skew: a long tail to the right (a few unusually large values).
-
Negative (left) skew: a long tail to the left (a few unusually small values).
-
Approximately symmetric: tails look balanced.
In IB Math, that matters because skewness changes what “typical” means. It also changes which statistic is safest to report, and which graph-based conclusions are allowed.
If you want the syllabus-aligned home base for this topic, start with RevisionDojo’s IB Math AI Statistics and Probability hub.
A quick exam checklist for skewness
Use this quick workflow before you write a single conclusion:
-
Identify whether the distribution is skewed or roughly symmetric.
-
Decide whether the mean is being pulled toward the tail.
-
Choose a “typical value” carefully (often the median for skewed data).
-
Mention spread appropriately (IQR is often more robust than standard deviation).
-
Link back to the context (what could create those extreme values?).
For targeted practice, RevisionDojo’s Statistics and Probability Questionbank (AI) is built for exactly these interpretation moments.
Why skewness changes your mean and median story
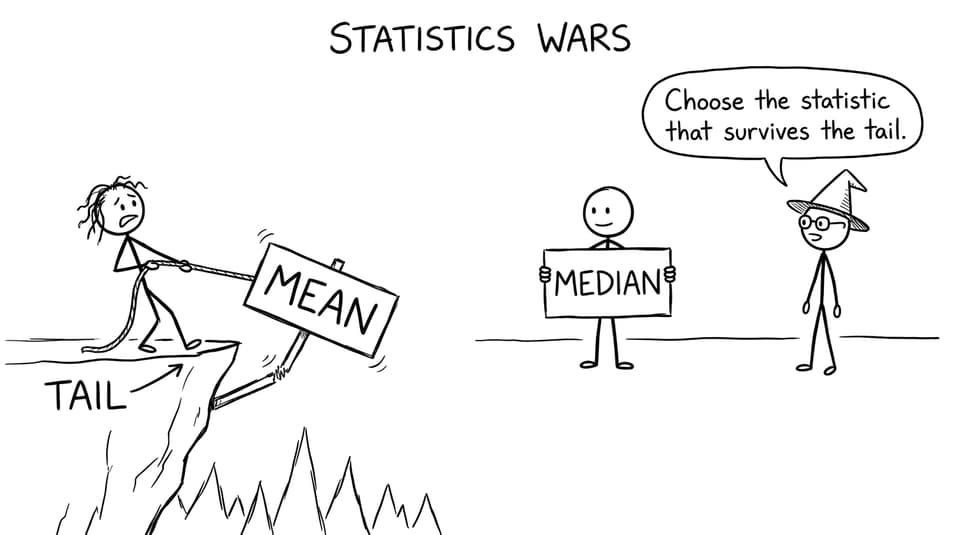
The mean listens to everything--including the weird stuff.
In a skewed distribution, the mean is pulled toward the tail, while the median tends to stay closer to the “main crowd” of values. That’s why examiners love skewness: it forces you to show judgment, not just calculation.
A common rule of thumb you can explain clearly:
-
Positive skew: mean > median
-
Negative skew: mean < median
That one sentence can unlock interpretation marks because it shows you understand what the summary statistics are doing.
If mean/median basics still feel slippery, revise them with SL 4.3 Mean, median, mode (AA) and the matching SL 4.3 Questionbank.
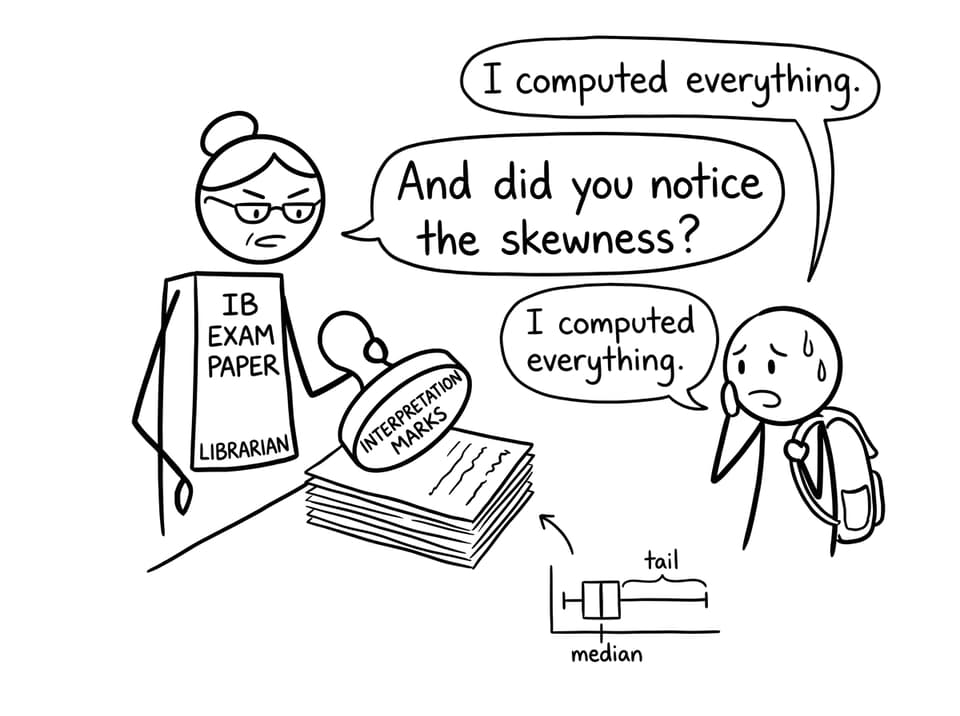
Where students lose marks: stating skewness without meaning
A painful IB Math pattern: students correctly say “positively skewed” and then stop.
But the markscheme often rewards the next step: what skewness implies.
Instead of writing only “positively skewed,” write:
- “Positively skewed, so a few large values pull the mean upward; the median is a more representative typical value.”
That is examiner-friendly because it connects shape to choice of statistic.
Skewness also interacts with outliers. If your data has a long tail, you should be on alert for unusual values that distort conclusions. This is exactly what RevisionDojo covers in Why Do Outliers Matter So Much in IB Math AI?.
Skewness shows up in graphs more than you think
In IB Math, skewness hides (or screams) depending on the representation:
-
Boxplots: skewness shows through an off-center median line or uneven whiskers. See Box and Whisker Plot in IB Math and Why Do Box Plots Reveal More Than Averages in IB Statistics.
-
Histograms: skewness can be exaggerated or flattened by class width. That’s the trap explained in Why Does Choosing the Wrong Class Width Distort Histograms in IB Maths.
-
Cumulative frequency graphs: they’re great for medians and quartiles, but bad for “shape” claims. RevisionDojo breaks this down in Why Cumulative Frequency Graphs Hide Distribution Shape.
And when you’re practicing interpretation as a skill (not just button-pressing), the workflow in How to Interpret Data in IB Math AI Using Technology is a strong companion.
Bringing it home (and picking up easy marks)
Skewness matters in IB Math because it turns “the answer” into “the story behind the answer.” The exam rewards students who notice when the mean is being pulled, when the median is safer, and when a graph invites caution.
If you want to make that skill automatic, build repetition with RevisionDojo: drill interpretation with the Questionbank, lock in definitions with Flashcards, review quickly with Study Notes, test yourself with Mock Exams and Predicted Papers, refine explanations with AI Chat and Grading tools, and strengthen real-world reasoning through the Coursework Library and Tutors. Skewness is a small concept with big consequences--and it’s one of the fastest ways to upgrade your statistics marks.

