

Correlation questions in Math SL can feel like a trick because they target something deeper than calculation: your instinct to explain patterns too quickly. You see two variables rise together on a scatterplot, and your brain quietly whispers, “That must be why.” In real life that whisper is comforting. In IB exams, it’s expensive.
In Math SL, “correlation does not imply causation” isn’t a slogan to repeat. It’s a discipline: describing what the data shows, admitting what it cannot show, and writing conclusions that sound like a careful scientist instead of a confident storyteller.

Quick exam checklist for Math SL correlation questions
Before you write your final line, run this Math SL checklist:
-
State the direction (positive/negative/none) and strength (weak/moderate/strong).
-
Refer to the scatter diagram shape and any outliers.
-
Use cautious language: “suggests,” “may be associated,” “cannot conclude.”
-
Mention at least one possible third variable (confounder) if it fits.
-
Only discuss cause if the question provides extra evidence (it usually doesn’t).
If you want fast practice with examiner-style prompts, RevisionDojo’s SL 4.4 Correlation Questionbank is built exactly for this kind of wording.
What correlation actually tells you in Math SL
Correlation is a number (often Pearson’s r) that summarises how strongly two variables move together in a linear way. In Math SL, that means you can responsibly say things like:
-
“There is a strong positive linear correlation between X and Y.”
-
“As X increases, Y tends to increase.”
That’s it. Correlation is about association, not a “because.” A high value of r doesn’t tell you which variable drives the other, or whether both are being driven by something else.
To revise the language and visuals that IB expects, keep Correlation of Data Notes (AI SL 4.4) open while you practice. It’s the difference between “I computed r” and “I interpreted r.”
What causation would require (and why your data rarely has it)
Causation is a claim about the world: changing X produces a change in Y. To make that claim, you generally need more than a scatterplot. In Math SL terms, causation would require:
-
A plausible mechanism (a sensible explanation of how X could affect Y)
-
Control of other variables (or a design that isolates the effect)
-
Evidence beyond a single observational dataset (often experiments or carefully designed studies)
Most IB datasets in statistics are observational. They’re designed to see whether you can resist overreaching. That’s why RevisionDojo repeatedly emphasises interpretation practice through its Study Notes, Flashcards, and targeted drills, not only calculations.
The hidden-variable trap: why correlation looks like causation
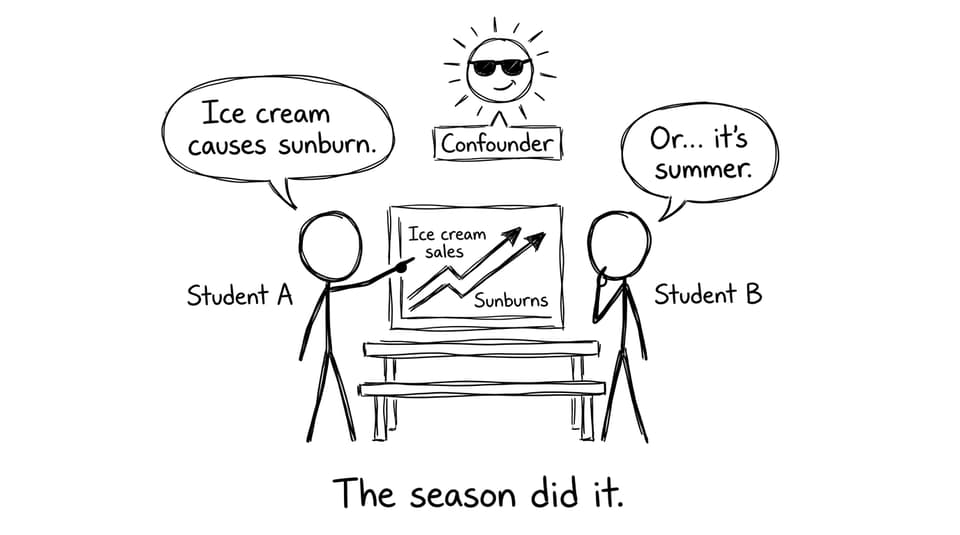
Humans are pattern machines. When two trends rise together, we feel a story forming. In Math SL, the examiners want you to interrupt that story with one key idea: a confounding variable (hidden variable) might influence both.
Classic example: ice cream sales and sunburn cases are correlated. Ice cream doesn’t burn skin. Summer does both.
In exam responses, even one sentence such as “This relationship may be influenced by a third factor such as…” often earns interpretation marks because it shows statistical maturity.
If you want to get sharper at this, pair correlation work with outlier awareness using Why Do Outliers Matter So Much in IB Math AI?. Outliers can create or destroy correlations, and they often change the story students want to tell.
How to phrase conclusions the IB will reward in Math SL
In Math SL, safe conclusions sound slightly restrained. That restraint is not weakness; it’s accuracy.
Try sentence frames like:
-
“The data shows a strong/weak (positive/negative) correlation between…”
-
“This suggests an association, but does not prove that…”
-
“A possible confounding factor could be…”
Avoid:
-
“X causes Y” (unless you’re explicitly given experimental context)
-
Repeating only r without interpretation
-
Ignoring context, outliers, or variable definitions
RevisionDojo’s SL 4.4 Pearson’s and scatter diagrams notes and Linear correlation bootcamps are useful when your issue isn’t the computation, but the wording.
Common Math SL mistakes that lose easy marks
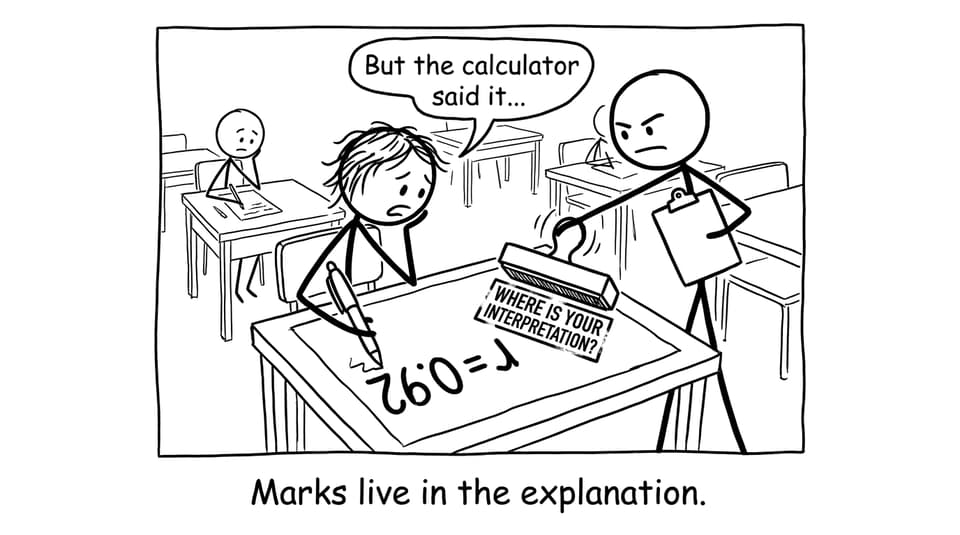
Most Math SL correlation mark losses come from tone, not algebra:
-
Treating correlation as proof
-
Forgetting to comment on strength and direction
-
Ignoring an obvious outlier
-
Using absolute language (“will,” “proves,” “therefore causes”)
-
Writing a conclusion with no mention of limitations
If you’ve ever felt surprised by low marks despite “getting r right,” Why Is Interpretation Graded More Than Calculation in IB Statistics explains the examiner logic clearly.
Closing: make Math SL statistics feel predictable
The point of “correlation does not imply causation” in Math SL is to train you to think like someone who respects evidence. Your calculator can produce r in seconds. Your grade depends on what you do with it.
If you want correlation questions to stop feeling like guesswork, build a routine with RevisionDojo: drill examiner-style prompts in the Questionbank, tighten explanations with Study Notes and Flashcards, pressure-test your reasoning with AI Chat, and measure progress with Mock Exams, Predicted Papers, and Grading tools. When you can explain correlation without accidentally claiming causation, Math SL stats becomes one of the most controllable parts of your exam.