


The first time you meet a normal distribution question in IB Math, it can feel like the exam quietly changed the rules.
You used to compute probability by counting outcomes, drawing a tree, or using a clear formula. Then the bell curve arrives and suddenly you’re told to translate your value into a different scale, consult a table or calculator command, and only then say what the probability means. The arithmetic isn’t the problem. The process feels indirect, like reading a map upside down.
A quick checklist that makes IB Math normal questions feel “natural”
When normal distribution questions feel unnatural in IB Math, it’s usually because one of these steps is missing:
-
Write down the model clearly: (X \sim N(\mu,\sigma^2)) and label (\mu) and (\sigma)
-
Decide what the question is really asking (greater than, less than, between, or “find the value”)
-
Sketch a bell curve and shade the region you want
-
Standardise with (z = \frac{x-\mu}{\sigma}) only when needed
-
Use technology (z-table, normalcdf, invNorm) to get the number
-
Interpret the probability in context (units, meaning, reasonableness)
If you want a strong home base for this topic, the SL 4.9 Normal distribution and calculations hub keeps the skills in one place.
Why normal distribution work feels indirect in IB Math
In most earlier probability topics, the value you’re given is already on the “right” scale. But normal distributions are continuous, and their probability density function doesn’t give nice integrals in the way students hope it will.
So IB Math trains a different skill: modelling many different real situations with one universal reference curve.
That’s what standardisation is doing. It’s not busywork. It’s a translation layer.
If you’re studying Applications & Interpretation as well, it helps to see how often this model reappears in different disguises: Why the Normal Distribution Appears Everywhere in IB Maths.
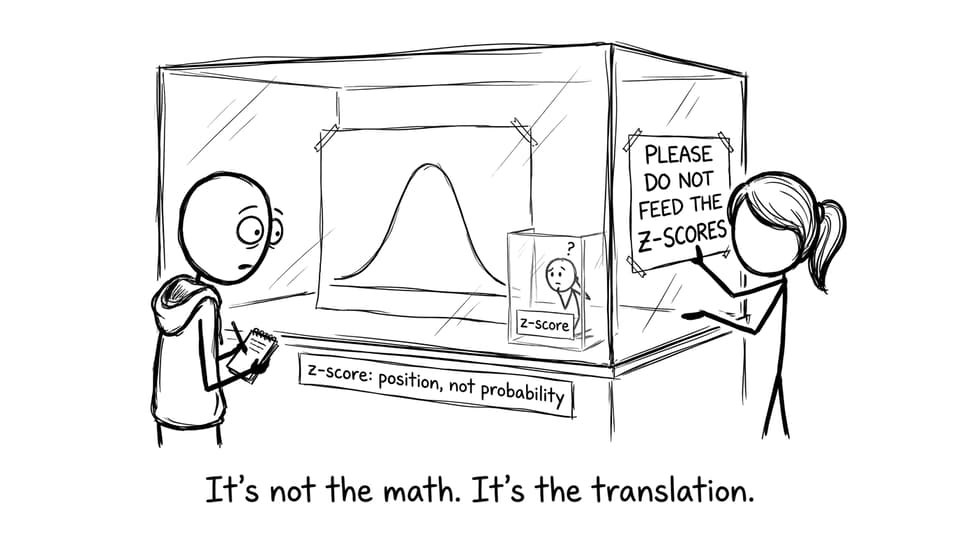
Why z-scores feel like a trick (but aren’t)
A z-score is a position statement: “how many standard deviations from the mean?” That is psychologically weird at first, because your brain wants the output to be a probability.
In IB Math, many errors happen when students collapse two separate ideas into one:
-
Standardising turns (x) into (z)
-
Finding probability turns (z) into an area under the curve
So when your calculator gives something like (z = 1.2), nothing probabilistic has happened yet. You’ve just moved from a real-world unit (cm, seconds, marks) to a universal measuring stick.
To strengthen that interpretation muscle, it also helps to revisit how (\mu) and (\sigma) shape the story: Why Students Misuse the Mean and Standard Deviation in Normal Distributions.
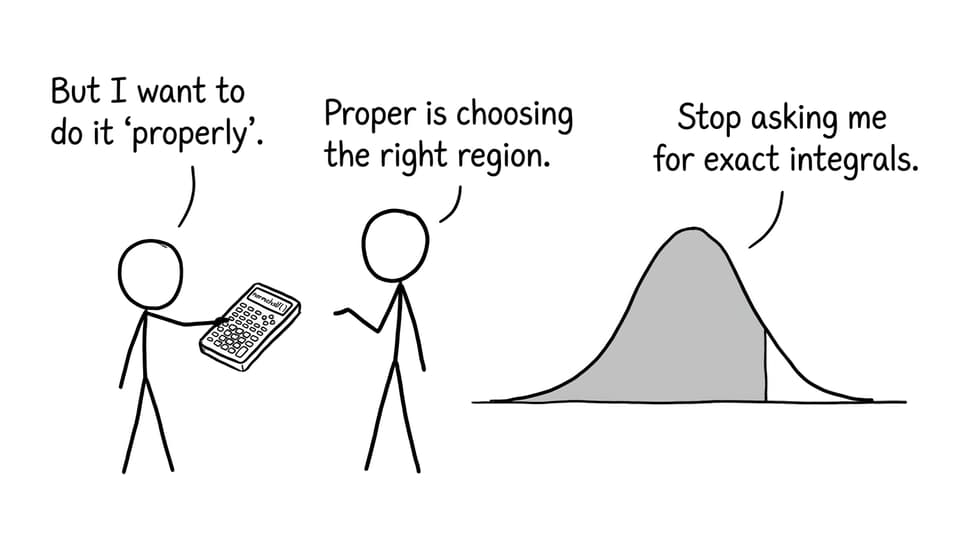
Why calculators and tables feel “awkward” in IB Math
Many students feel a subtle guilt when they rely on a table or calculator command. Like the “real math” should be doable by hand.
But IB Math is assessing something more valuable: can you choose the correct region, set up the right boundaries, and explain what the number means?
That’s why targeted practice matters. A good loop is:
-
Read explanation once in Statistics & Probability notes
-
Drill a few focused questions in the Normal distribution and calculations Questionbank
-
Use Flashcards for Statistics & Probability to keep notation automatic
RevisionDojo’s AI Chat is also perfect for the “Why did I shade that region?” moment, and the Grading tools help you see whether your method and final interpretation would earn the marks.
The real trap: one-tailed vs two-tailed thinking in IB Math
Normal distribution questions punish rushed reading.
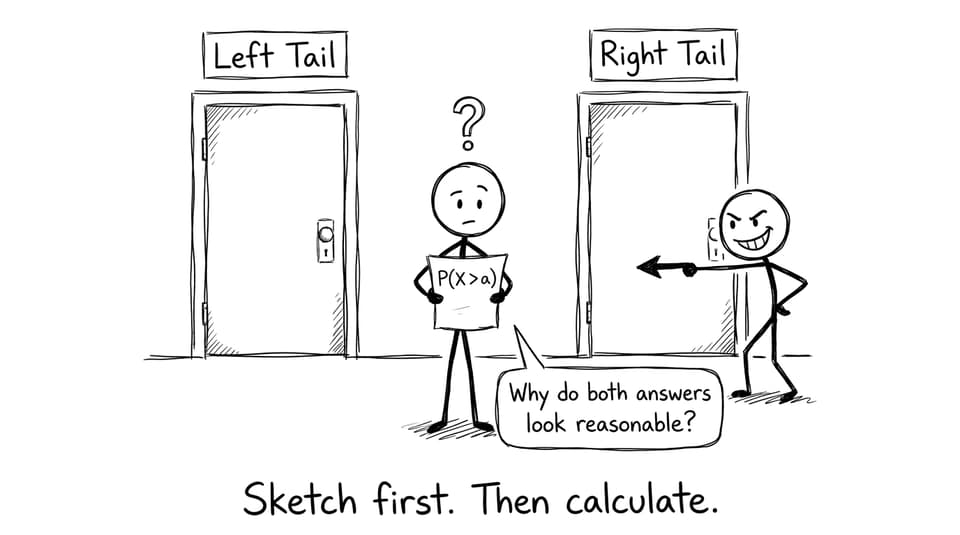
A classic IB Math mistake is answering “less than” when the question asks “greater than,” or forgetting that “within 1 standard deviation” is a two-sided region.
The fix is almost boring: sketch first. Shade the region. Then calculate.
If you want more exam-behaviour advice (timing, checking, staying calm), Effective Study Strategies for the IB Math SL Exam pairs well with probability revision.
Bringing it home: make IB Math feel less like translation and more like thinking
Normal distribution calculations feel unnatural in IB Math because they are indirect by design. The course is teaching you to model, translate, choose a region, and interpret results with precision.
If you want to turn that discomfort into confidence, build a simple routine with RevisionDojo: start with the Study Notes, drill the Questionbank, lock in the language with Flashcards, ask AI Chat the questions you’re embarrassed to ask out loud, then validate your method with Grading tools. Add Mock Exams and Predicted Papers when you’re ready to train timing.
When the process becomes familiar, the bell curve stops feeling like a weird creature behind glass. It becomes what it always was: a story about variation, told in the most standard language possible, IB Math.