


The quiet mark-saver most IB Math students skip
Somewhere in every IB Math exam, there’s a student who knows the topic, understands the question, and still drops marks for an avoidable reason: their thinking never becomes visible.
In IB Math AI, the examiner isn’t only hunting for a final number. They’re checking whether your reasoning is coherent, whether you interpreted the situation correctly, and whether your method deserved credit even if arithmetic went sideways. That’s where diagrams and sketches step in. Not as decoration, but as communication.
Quick checklist: when a diagram is worth it in IB Math AI
Use this fast checklist before you write another long paragraph:
-
Probability: tree diagrams, Venn diagrams, labeled regions
-
Normal distribution: curve + shading + cut-off values
-
Regression and modelling: scatter sketch, line/curve trend, outliers
-
Functions and graphs: shape, intercepts, asymptotes, domain notes
-
Interpretation questions: visual support for your conclusion
If you want aligned practice right away, start from the main IB Mathematics Applications & Interpretation resources hub.
Why diagrams earn marks in IB Math AI
Diagrams make your thinking visible (and markable)
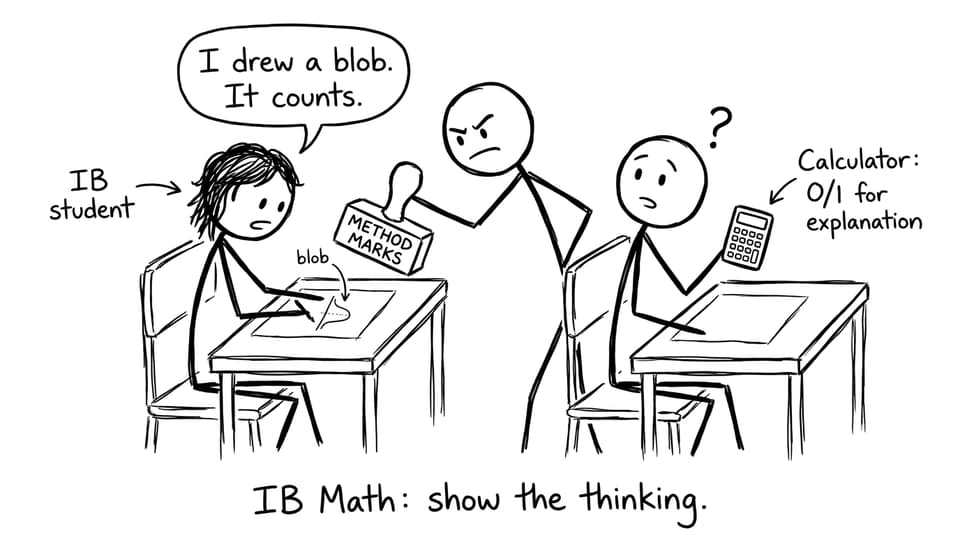
A sketch turns invisible reasoning into something the examiner can award. In IB Math, method marks often depend on whether you set things up correctly: the right region, the right direction, the right relationship.
For example, shading the correct tail on a normal curve shows that you understood the probability statement before you even touch your calculator. The same is true when you quickly sketch a scatter plot and indicate the trend: it signals interpretation, not just computation.
To build that habit, pair short concept review with deliberate practice in the Questionbank, where you can train yourself to add the sketch as part of your method.
Diagrams reduce ambiguity (words often don’t)
Words like “greater than,” “at most,” “intersection,” and “between” look obvious until you’re stressed and rushing. A small diagram forces precision.
A shaded Venn region, a labeled interval on an axis, or a quick curve with a marked boundary makes your intention unmissable. In IB Math AI, that clarity is a real advantage because many questions reward interpretation: what does the model mean, what does the region represent, what does the parameter suggest?
If you find your solutions are correct but your communication is messy, Effective Note-Taking Strategies for IB Math Students has a simple structure for showing method cleanly.
Diagrams prevent errors (and protect method marks)
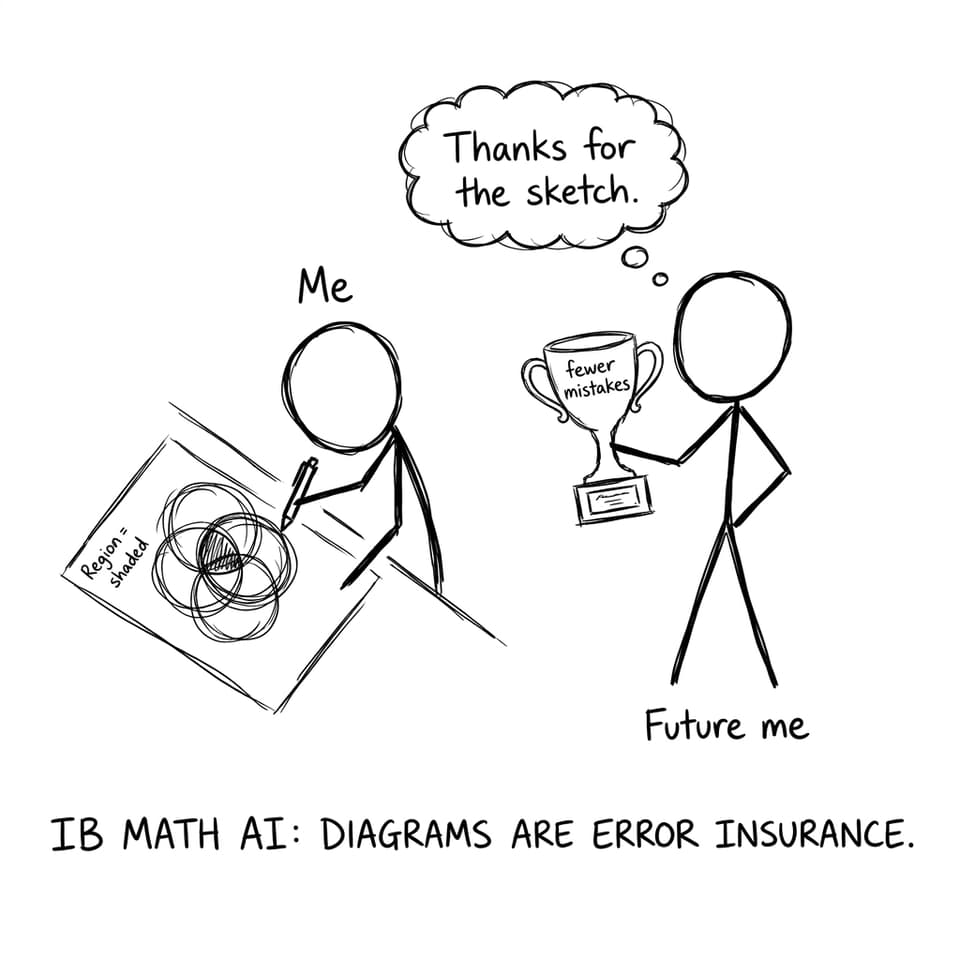
Sketches are also error insurance. In IB Math, a quick picture catches classic mistakes:
-
Wrong tail shaded in normal distribution
-
Mixed-up “A and B” vs “A or B” in probability
-
Regression line interpreted in the wrong direction
-
Sign errors from misreading a graph’s region
Even if you later make a numerical slip, the correct diagram can support follow-through marks because your method is still logically consistent.
For graph-focused questions, it helps to rehearse a repeatable approach like the one in How Do You Sketch Function Graphs Without Getting Lost in IB Maths?.
IB Math AI rewards “real analytical practice”
In real data work, people sketch constantly: to sanity-check, to spot relationships, to test assumptions. IB Math AI is designed to reward that same behaviour.
That’s also why RevisionDojo’s Study Notes and Flashcards lean into interpretation, not just formulas. When you combine Notes, Flashcards, and AI Chat to clarify a concept, then pressure-test it with Mock Exams and Predicted Papers, diagrams become automatic because you’re practicing the way you’ll be assessed.
A good starting system is outlined in How to Score 7 in IB Math AI SL.
The easiest way to add diagrams without losing time
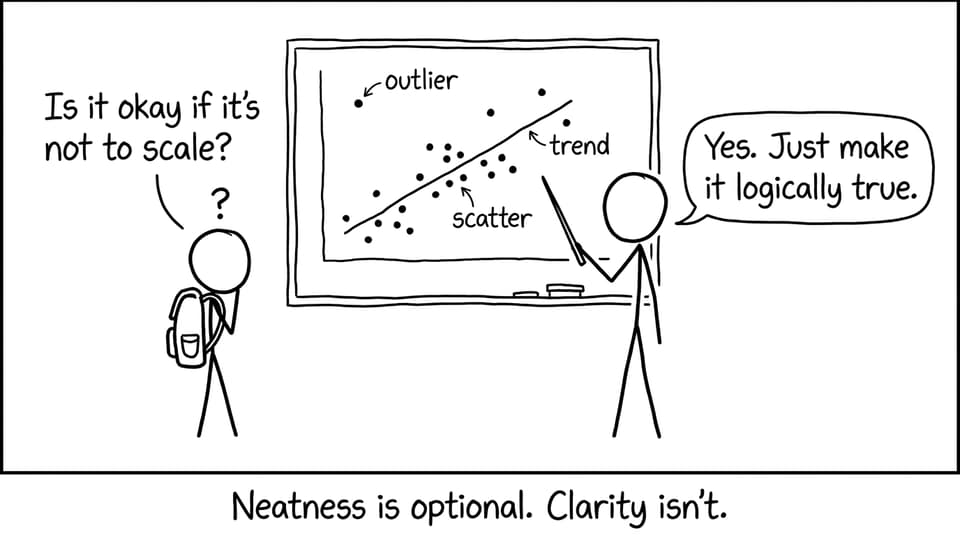
In IB Math AI, your sketch should be:
-
Small (2-5 cm wide is often enough)
-
Labeled (key values, regions, variables)
-
Logically true (shape and relationships correct)
-
Connected to your sentence (“Since the shaded region is the upper tail…”)
If time management is the issue, build it into your routine using The Ultimate IB Math Study Routine for Busy Students. Then use Grading tools and Tutors inside RevisionDojo to get feedback on whether your diagrams are doing real work, not just taking space.
Conclusion: in IB Math, a sketch is a signal
In IB Math AI, diagrams and sketches are not “extra working.” They’re proof that you understood what the question was really asking. They reduce ambiguity, prevent errors, and give examiners something they can actually reward.
If you want to make that skill automatic, use RevisionDojo as a full loop: Study Notes to learn the idea, Flashcards to lock the language, Questionbank to drill exam-style setups, AI Chat to fix confusion fast, and Mock Exams plus Predicted Papers to rehearse under time pressure. Clear thinking deserves clear visuals, and in IB Math, that clarity turns directly into marks.