


If you have ever opened a spreadsheet and felt your confidence evaporate, you are not alone. A Statistics IA often begins with a comforting idea: “I will just collect some data and run a few calculations.” Then you realise the hard part is not the maths. It is the decisions. What counts as good data? Which graphs are meaningful? How do you explain results without overclaiming?
A strong IA is not a pile of numbers. It is a small, honest investigation with a clear question, defensible methods, and interpretation that reads like you are guiding the examiner through your thinking.
Statistics IA checklist (save this before you write)
Use this quick checklist to keep your IA focused:
-
A specific title and a focused research question
-
A short rationale (why this matters and why you chose it)
-
Clear variables (with units) and a justified data source
-
A transparent sampling method and data cleaning notes
-
Descriptive statistics and appropriate graphs
-
Inferential statistics (only what your question truly needs)
-
Interpretation tied directly to the research question
-
Evaluation: limitations, assumptions, and realistic improvements
-
Professional communication: labels, captions, citations, and structure
If you want a bigger planning framework, compare your outline with How to Structure Your IB Math IA Logically.
Start your Statistics IA with a title and research question
Your IA title is a promise. It tells the reader what kind of relationship or pattern you are investigating. Your research question then makes that promise testable.
A helpful rule: if your research question cannot be answered with data and a statistical method, it is too vague.
Good research questions are:
-
Specific (names variables and context)
-
Measurable (data can realistically be collected)
-
Analytical (invites a method like correlation, regression, or a test)
If you are stuck refining wording, use How to Write a Strong IA Research Question as your guide.
Add a short rationale that sounds like you
The rationale in an IA is not filler. It is the first signal of personal engagement. Keep it short, but concrete.
Include:
-
Why you chose this context (school, sports, sleep, music, social media, weather)
-
Why the variables are interesting together
-
What you expect to find (a hypothesis is fine, as long as it stays humble)
This is also where you quietly show you understand feasibility. An IA that can be completed cleanly often scores better than an ambitious one that collapses under messy data.
Data collection for a defensible IA
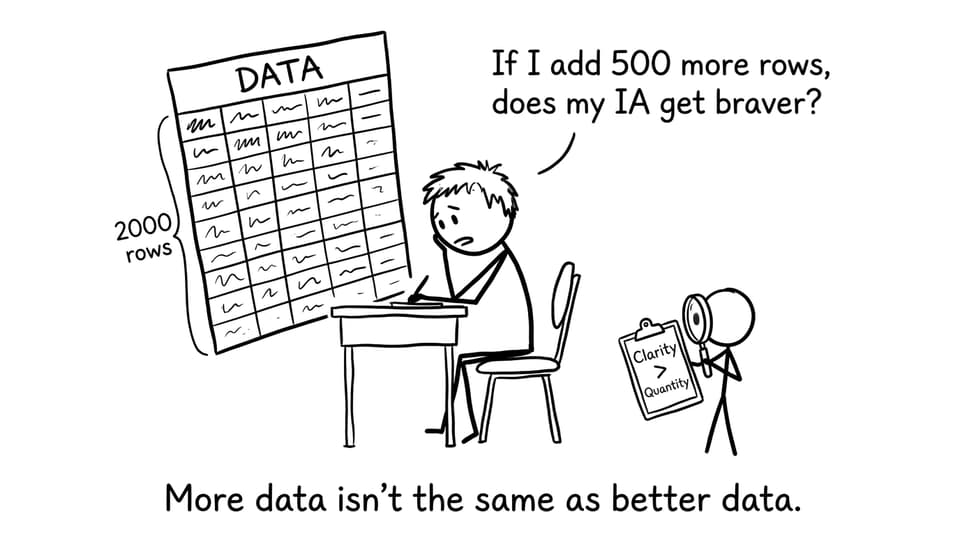
Most IA problems come from weak data choices, not weak calculations. Examiners reward credibility.
Choose primary or secondary data (and justify it)
-
Primary data works well when you can collect enough points reliably (surveys, timed trials, measurements).
-
Secondary data can be excellent if it is reputable and relevant. The key is documenting the source and explaining why it fits your question.
For more practical guidance, use How to Use Data Effectively in Your IB Math IA.
Explain sampling like it matters (because it does)
Your IA should say:
-
Who or what the sample represents
-
How participants or observations were chosen
-
Why the sample size is reasonable for your method
Even a simple statement such as “I used convenience sampling from my class” is better than silence, because it allows evaluation later.
Define variables and units clearly
Write one tight paragraph defining:
-
Independent variable
-
Dependent variable
-
Units and measurement method
-
Any controls (if relevant)
Analysis: what to include (and what to avoid)
A strong IA analysis section moves in layers: describe the data, visualise it, then test a claim.
Descriptive statistics (your foundation)
Include measures that match your data type:
-
Mean and median (compare them if skew is possible)
-
Standard deviation or interquartile range
-
Outlier identification (and what you did about it)
Do not just list numbers. Explain what they suggest about the distribution.
Graphs that actually help
Use visuals as evidence, not decoration:
-
Histogram or boxplot for distribution and spread
-
Scatter plot for relationships
-
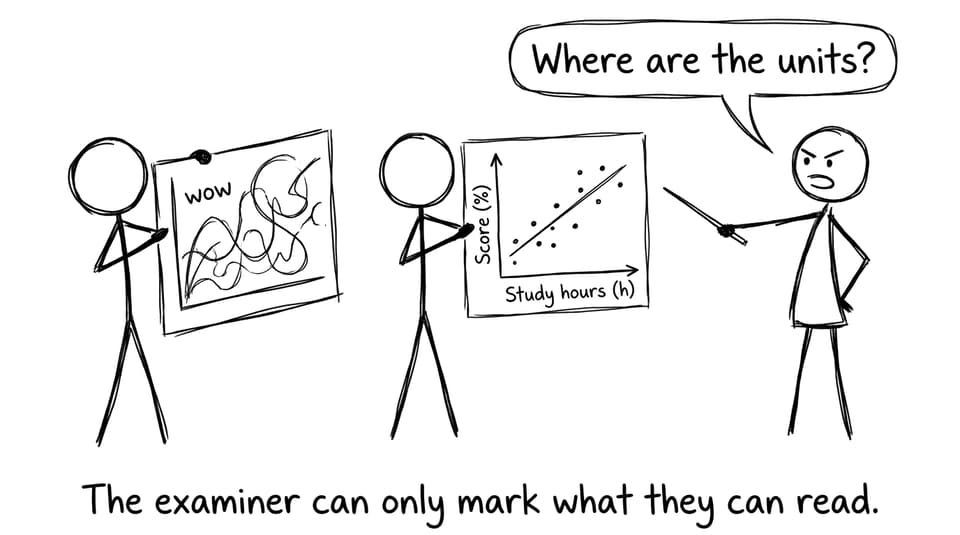
Clear titles, labelled axes, and units
Inferential statistics (only when justified)
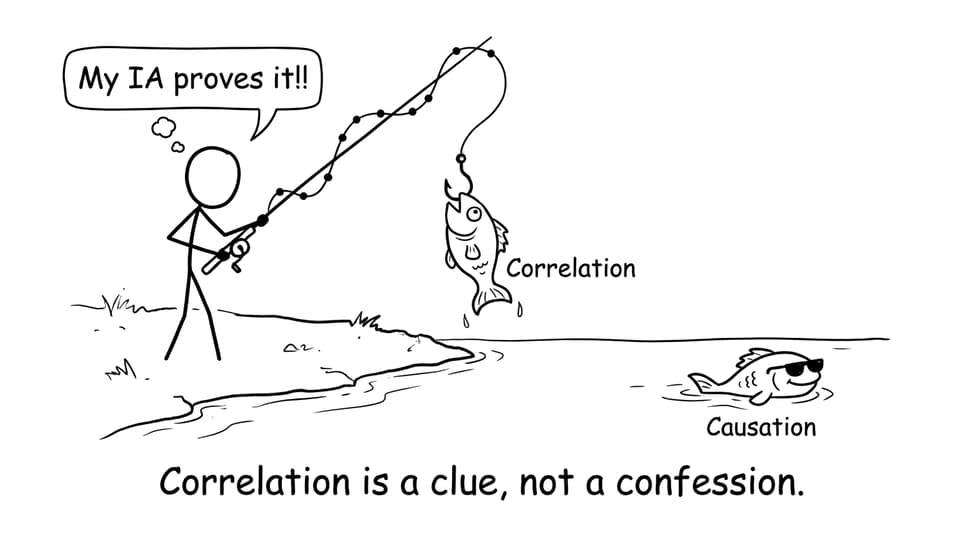
If your IA asks about a relationship, correlation and regression are common tools. But interpretation must stay careful. You are not “proving” anything. You are estimating and evaluating.
To improve your explanations, lean on How to Explain Statistical Analysis in the IB Math IA and practise the same techniques using the Statistics Data Toolkit guide.
Interpretation and conclusion: tell the data story
This is where many IA drafts become either too cautious (“Here are numbers”) or too bold (“This proves everything”). The best middle ground is simple:
-
Restate the research question
-
Summarise what the results suggest
-
Link evidence to context
-
Use precise language: “suggests,” “indicates,” “is consistent with”
A good conclusion sounds like someone who trusts their method but respects uncertainty.
Evaluation: limitations that earn marks
Your evaluation should read like a calm audit of your own work.
Include:
-
Sampling limitations (bias, representativeness)
-
Measurement error or survey issues
-
Model limitations (linearity assumptions, residual patterns)
-
Improvements that are specific and realistic
If you want a reliable structure for this part, borrow the reflection approach from IB Math: 10 Tips for a Strong IA Commentary.
Presentation: make your IA easy to mark
Presentation is not decoration. It is exam technique on paper.
-
Number and label graphs and tables
-
Add brief captions explaining what each figure shows
-
Cite data sources properly
-
Keep formatting consistent
Use How to Format and Present Your IB Math IA Professionally as your final polish checklist.
Build your IA and your exam confidence with RevisionDojo
A good IA does something surprising: it improves your exam performance. When you learn to justify a model, interpret variation, and explain statistics clearly, you also get better at Paper-style reasoning.
RevisionDojo helps you run that loop calmly: practise skills in the Questionbank, tighten concepts with Study Notes and Flashcards, clarify steps using AI Chat, and check progress with Grading tools and the Coursework Library. When exam season gets close, combine Predicted Papers and Mock Exams for realistic timing practice, and reach out to Tutors when you need human feedback.
If you are ready to make your next IA draft more focused and easier to mark, start with the IB Maths AI IA Grader and build from there.